数据库 记录一下 dashboard 性能优化 (10s->1ms)

hooopo · April 12, 2021 · Last by hxgdzyuyi replied at April 11, 2022 · 2741 hits
Topic has been selected as the excellent topic by the admin.

记录一次性能优化

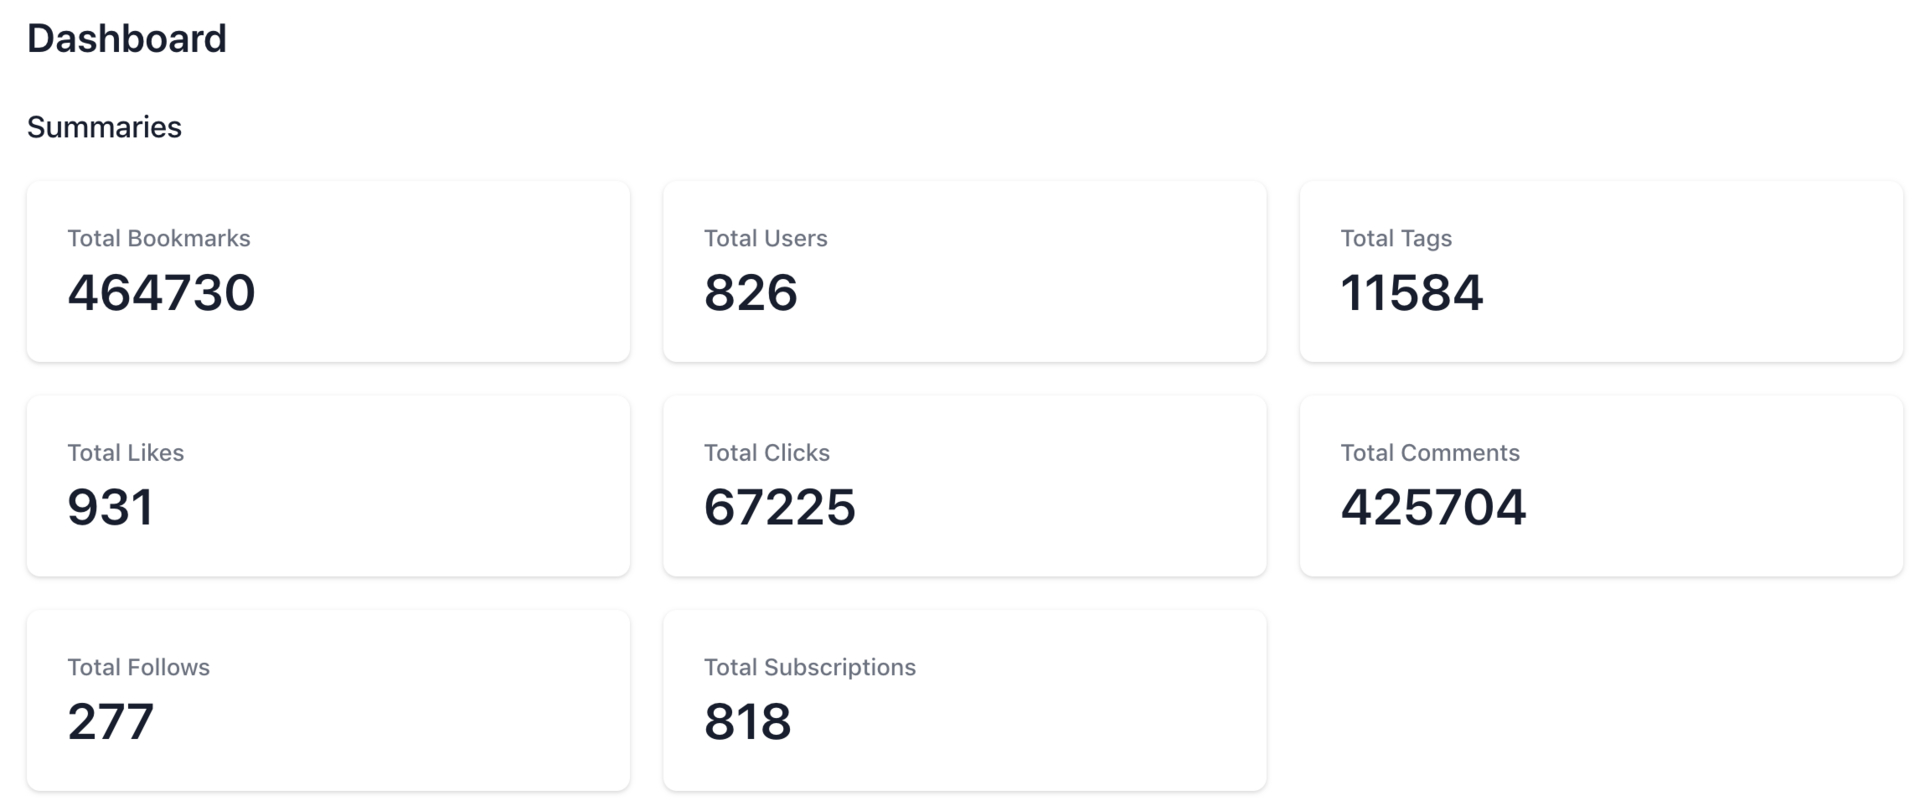
Hackershare 后台的一个 Dashboard 页面,由于很多统计类的查询,响应越来越慢,差不多要十几秒打开。主要是有两个 50w 左右的数据表,count 非常慢,还有一部分原因就是这台 2c4g 的服务器部署了很多程序,CPU 经常被其他服务占用。

大概的数据量:

hackershare=# \dt+
                              List of relations
 Schema |            Name            | Type  | Owner  |  Size   | Description
--------+----------------------------+-------+--------+---------+-------------
 public | bookmarks                  | table | deploy | 1259 MB |
 public | clicks                     | table | deploy | 4360 kB |
 public | comments                   | table | deploy | 134 MB  |
 public | follows                    | table | deploy | 48 kB   |
 public | likes                      | table | deploy | 88 kB   |
 public | rss_sources                | table | deploy | 1280 kB |
 public | tag_subscriptions          | table | deploy | 88 kB   |
 public | taggings                   | table | deploy | 117 MB  |
 public | tags                       | table | deploy | 2200 kB |
 public | users                      | table | deploy | 2848 kB |

第一招,使用 union all,把多条 count 合并成一条语句:

select 'bookmark' as key, count(*) as count from bookmarks

UNION ALL

select 'comment' as key, count(*) as count from comments

UNION ALL

select 'click' as key, count(*) as count from clicks

UNION ALL 

others

返回结构大概这样:

   key    | count
----------+--------
 click    |  65103
 comment  | 421423
 bookmark | 465078

比之前的有提升,但效果不大...

第二招,使用 explain

# usage
# FastCount.new(User.all).call
# => 826
# FastCount.new(User.where("id > 200")).call
# => 665

class FastCount
  attr_reader :scope, :sql

  def initialize(scope)
    @scope = scope
    @sql = scope.to_sql
  end

  def call
    explain_sql = "explain (format json) #{sql}"
    result = ApplicationRecord.connection.execute(explain_sql)[0]["QUERY PLAN"]
    json = JSON.parse(result)
    json[0]["Plan"]["Plan Rows"].to_i
  end
end

看看效果:

explain (format json)  select * from bookmarks;
             QUERY PLAN
-------------------------------------
 [                                  +
   {                                +
     "Plan": {                      +
       "Node Type": "Seq Scan",     +
       "Parallel Aware": false,     +
       "Relation Name": "bookmarks",+
       "Alias": "bookmarks",        +
       "Startup Cost": 0.00,        +
       "Total Cost": 89629.30,      +
       "Plan Rows": 464730,         +
       "Plan Width": 1278           +
     }                              +
   }                                +
 ]
(1 row)

Time: 0.898 ms

不到 1 毫秒!!

另外,居然可以支持带过滤条件甚至带 JOIN 语句的 count,比如:

FastCount.new(User.where("id > 200")).call
  • 适用场景:分页和 dashboard 之类不需要数据绝对准确,但对性能还有一些要求的场景。
  • 缺点:并不能保证数据绝对准确,取决于你的 auto vacuum 设置,一般情况下如果你的表记录足够大,并且更新频繁,使用这种方案几乎误差范围都是很小的。

Full Code: https://github.com/hackershare/hackershare/pull/115/files

呐尼?!用 explain 来查询 😳

Reply to Rei

快如⚡

统计的玩意加个缓存咯。。

居然还有这种操作。。。。。。

MySQL 有类似的,压测的时候用过,不过误差有点大,也没仔细找原因。

mysql> SELECT count(*) AS TOTALNUMBEROFTABLES
   -> FROM INFORMATION_SCHEMA.TABLES
   -> WHERE TABLE_SCHEMA = 'business';

Oracle 有个 Zone Map 的优化,会单独记录 count 之类的。

8 Floor has deleted

这个是表记录条数,不能加条件的,实际就没什么用了。

高级高级

好奇,你咋不弄几个 counter 存统计数据。

每隔一小时计算一下 count 就可以了。

对于这种待条件的查询

FastCount.new(User.where("id > 200")).call

数据库的 explain 的估算值好像是根据直方图来估算的。如果直方图的粒度很粗,字段的值的分布也不均匀,估算值可能会有很大的误差。

Reply to xiaoronglv

一个小时的误差还真赶不上这种,有了新的过滤条件还要维护,在索引里的一般误差不是很大,这种方案的前提是表大并且更新频繁,auto vacuum 就会运行的频率高,数据也就准了

不如加个 redis 吧

赞这个脑洞

counter cache 不好吗。

骚操作!学到了👍

数据库自己都被玩懵了

这个是真的骚,666

骚气的操作,之前 pg 统计各表数据我是用 pg_class 这个表来搞的,但是加不了条件查询,你这更骚

explain 的结果不准吧…… 本质上它是 PostgreSQL 为表存储的一套大概统计数据,用来决定 query plan 的。不过这脑洞确实大。

Reply to darkbaby123

一定不完全准确,但只要你的 vacuum 执行正常,我观察下来,表越大误差越低。

之前用过一个 function 来把 explain 的估计 count 值拿出来。但还没想到这个 format json 的操作,这个可以拼接任意条件查询了,之前写法要是这么拼有注入风险。

jasl mark as excellent topic. 17 Apr 03:44

表大一点,计划会复杂,即使拿里层的 Plan Rows 数据也取不出来

olive=> explain (format json) select count(*) from audits;
-[ RECORD 1 ]-------------------------------------------------------------
QUERY PLAN | [                                                            +
           |   {                                                          +
           |     "Plan": {                                                +
           |       "Node Type": "Aggregate",                              +
           |       "Strategy": "Plain",                                   +
           |       "Partial Mode": "Finalize",                            +
           |       "Parallel Aware": false,                               +
           |       "Startup Cost": 1596821.82,                            +
           |       "Total Cost": 1596821.83,                              +
           |       "Plan Rows": 1,                                        +
           |       "Plan Width": 8,                                       +
           |       "Plans": [                                             +
           |         {                                                    +
           |           "Node Type": "Gather",                             +
           |           "Parent Relationship": "Outer",                    +
           |           "Parallel Aware": false,                           +
           |           "Startup Cost": 1596821.60,                        +
           |           "Total Cost": 1596821.81,                          +
           |           "Plan Rows": 2,                                    +
           |           "Plan Width": 8,                                   +
           |           "Workers Planned": 2,                              +
           |           "Single Copy": false,                              +
           |           "Plans": [                                         +
           |             {                                                +
           |               "Node Type": "Aggregate",                      +
           |               "Strategy": "Plain",                           +
           |               "Partial Mode": "Partial",                     +
           |               "Parent Relationship": "Outer",                +
           |               "Parallel Aware": false,                       +
           |               "Startup Cost": 1595821.60,                    +
           |               "Total Cost": 1595821.61,                      +
           |               "Plan Rows": 1,                                +
           |               "Plan Width": 8,                               +
           |               "Plans": [                                     +
           |                 {                                            +
           |                   "Node Type": "Index Only Scan",            +
           |                   "Parent Relationship": "Outer",            +
           |                   "Parallel Aware": true,                    +
           |                   "Scan Direction": "Forward",               +
           |                   "Index Name": "index_audits_on_created_at",+
           |                   "Relation Name": "audits",                 +
           |                   "Alias": "audits",                         +
           |                   "Startup Cost": 0.56,                      +
           |                   "Total Cost": 1548601.80,                  +
           |                   "Plan Rows": 18887923,                     +
           |                   "Plan Width": 0                            +
           |                 }                                            +
           |               ]                                              +
           |             }                                                +
           |           ]                                                  +
           |         }                                                    +
           |       ]                                                      +
           |     }                                                        +
           |   }                                                          +
           | ]

olive=> select id from audits order by id desc limit 1;
-[ RECORD 1 ]
id | 45752411

不知道是不是版本差异

psql (13.1, server 11.8)

Reply to ysllyfe

不需要 select count(*),直接用 select *

Reply to hooopo
                  QUERY PLAN
-----------------------------------------------
 [                                            +
   {                                          +
     "Plan": {                                +
       "Node Type": "Seq Scan",               +
       "Parallel Aware": false,               +
       "Relation Name": "nb_command_analyses",+
       "Alias": "nb_command_analyses",        +
       "Startup Cost": 0.00,                  +
       "Total Cost": 2686346.72,              +
       "Plan Rows": 71053872,                 +
       "Plan Width": 222                      +
     }                                        +
   }                                          +
 ]
(1 row)

OK 了~ 眼瞎,没有看仔细

带索引的和只有 filter 的条件都很快 😊

Reply to ysllyfe

7000w?误差多少?

Reply to hooopo

整个表我没有去算,而且可能没有 vacuum 了最近,我拿了单条的刚刚看了一下

 explain (format json)  select * from  nb_command_analyses where created_at > '2021-01-01' and device_id = 'F34479F6F935';
                                     QUERY PLAN
-------------------------------------------------------------------------------------
 [                                                                                  +
   {                                                                                +
     "Plan": {                                                                      +
       "Node Type": "Index Scan",                                                   +
       "Parallel Aware": false,                                                     +
       "Scan Direction": "Forward",                                                 +
       "Index Name": "nba_edcm_idx",                                                +
       "Relation Name": "nb_command_analyses",                                      +
       "Alias": "nb_command_analyses",                                              +
       "Startup Cost": 0.57,                                                        +
       "Total Cost": 1291320.82,                                                    +
       "Plan Rows": 3669,                                                           +
       "Plan Width": 222,                                                           +
       "Index Cond": "((device_id)::text = 'F34479F6F935'::text)",                  +
       "Filter": "(created_at > '2021-01-01 00:00:00'::timestamp without time zone)"+
     }                                                                              +
   }                                                                                +
 ]
(1 row)

explain (format json)  select * from  nb_command_analyses where created_at > '2021-02-01' and device_id = 'F34479F6F935';
                                     QUERY PLAN
-------------------------------------------------------------------------------------
 [                                                                                  +
   {                                                                                +
     "Plan": {                                                                      +
       "Node Type": "Index Scan",                                                   +
       "Parallel Aware": false,                                                     +
       "Scan Direction": "Forward",                                                 +
       "Index Name": "nba_edcm_idx",                                                +
       "Relation Name": "nb_command_analyses",                                      +
       "Alias": "nb_command_analyses",                                              +
       "Startup Cost": 0.57,                                                        +
       "Total Cost": 1291320.82,                                                    +
       "Plan Rows": 2938,                                                           +
       "Plan Width": 222,                                                           +
       "Index Cond": "((device_id)::text = 'F34479F6F935'::text)",                  +
       "Filter": "(created_at > '2021-02-01 00:00:00'::timestamp without time zone)"+
     }                                                                              +
   }                                                                                +
 ]
(1 row)


explain (format json)  select * from  nb_command_analyses where created_at > '2021-03-01' and device_id = 'F34479F6F935';
                                     QUERY PLAN
-------------------------------------------------------------------------------------
 [                                                                                  +
   {                                                                                +
     "Plan": {                                                                      +
       "Node Type": "Index Scan",                                                   +
       "Parallel Aware": false,                                                     +
       "Scan Direction": "Forward",                                                 +
       "Index Name": "nba_edcm_idx",                                                +
       "Relation Name": "nb_command_analyses",                                      +
       "Alias": "nb_command_analyses",                                              +
       "Startup Cost": 0.57,                                                        +
       "Total Cost": 1291320.82,                                                    +
       "Plan Rows": 2416,                                                           +
       "Plan Width": 222,                                                           +
       "Index Cond": "((device_id)::text = 'F34479F6F935'::text)",                  +
       "Filter": "(created_at > '2021-03-01 00:00:00'::timestamp without time zone)"+
     }                                                                              +
   }                                                                                +
 ]
(1 row)

explain (format json)  select * from  nb_command_analyses where created_at > '2021-04-01' and device_id = 'F34479F6F935';
                                     QUERY PLAN
-------------------------------------------------------------------------------------
 [                                                                                  +
   {                                                                                +
     "Plan": {                                                                      +
       "Node Type": "Index Scan",                                                   +
       "Parallel Aware": false,                                                     +
       "Scan Direction": "Forward",                                                 +
       "Index Name": "nba_edcm_idx",                                                +
       "Relation Name": "nb_command_analyses",                                      +
       "Alias": "nb_command_analyses",                                              +
       "Startup Cost": 0.57,                                                        +
       "Total Cost": 1291320.82,                                                    +
       "Plan Rows": 1401,                                                           +
       "Plan Width": 222,                                                           +
       "Index Cond": "((device_id)::text = 'F34479F6F935'::text)",                  +
       "Filter": "(created_at > '2021-04-01 00:00:00'::timestamp without time zone)"+
     }                                                                              +
   }                                                                                +
 ]
(1 row)

explain (format json)  select * from  nb_command_analyses where created_at > '2021-05-01' and device_id = 'F34479F6F935';
                                     QUERY PLAN
-------------------------------------------------------------------------------------
 [                                                                                  +
   {                                                                                +
     "Plan": {                                                                      +
       "Node Type": "Index Scan",                                                   +
       "Parallel Aware": false,                                                     +
       "Scan Direction": "Forward",                                                 +
       "Index Name": "nba_edcm_idx",                                                +
       "Relation Name": "nb_command_analyses",                                      +
       "Alias": "nb_command_analyses",                                              +
       "Startup Cost": 0.57,                                                        +
       "Total Cost": 1291320.82,                                                    +
       "Plan Rows": 310,                                                            +
       "Plan Width": 222,                                                           +
       "Index Cond": "((device_id)::text = 'F34479F6F935'::text)",                  +
       "Filter": "(created_at > '2021-05-01 00:00:00'::timestamp without time zone)"+
     }                                                                              +
   }                                                                                +
 ]
(1 row)

结果是 1.1 -> 3669
2.1 -> 2938
3.1 -> 2416
4.1 -> 1401
5.1 -> 310

实际count 下来 1.1 -> 3 

select count(*) from  nb_command_analyses where created_at > '2021-01-01' and device_id = 'F34479F6F935';
 count
-------
     3
(1 row)

这个表最后一条

select id from nb_command_analyses order by id desc limit 1;
    id
----------
 72204914
(1 row)
Reply to ysllyfe

如果你的返回结果集已经很少了就没必要用这种方法了。你直接 count 也不会慢到哪里去。这种场景是查返回值会很大的那种 count 的

Reply to hooopo

嗯,只是模拟一下,有的时候不知道预期的返回结果,比如有些节点多,有些节点少的情况

# frozen_string_literal: true

# ApproximateCount count on large Postgres tables
# designed to be `extend` into inheritance classes of ActiveRecord::Base
# Example:
# User.approximate_count
# # (1.3ms) EXPLAIN (FORMAT JSON) SELECT "users".* FROM "users"
# # (0.8ms)  SELECT COUNT(*) FROM "users"
# # => 0 
#
# User.where('created_at > ?', 7.days.ago).approximate_count
# # (1.6ms)  EXPLAIN (FORMAT JSON) SELECT "users".* FROM "users" WHERE (created_at > '2021-06-11 15:20:49.870311')
# # (0.8ms)  SELECT COUNT(*) FROM "users" WHERE (created_at > '2021-06-11 15:20:49.870311')
# # => 0
module ApproximateCount
  def approximate_count(threshold=10_000)
    explain_sql = "EXPLAIN (FORMAT JSON) #{all.to_sql}"
    result = self.connection.execute(explain_sql)[0]["QUERY PLAN"]
    json = JSON.parse(result)
    val = json[0]["Plan"]["Plan Rows"].to_i

    return val if val > threshold
    self.count
  end
end

class ApplicationRecord < ActiveRecord::Base
  extend ApproximateCount
  self.abstract_class = true
end

施加了一点点魔法

hackershare 是跑在 2c4g 机器的 docker 里头的吗。

Reply to hxgdzyuyi

没用 docker 部署,是 2c4g,负载很低

MySQL,误差有点大……

count 10590362 
explain 7159658
You need to Sign in before reply, if you don't have an account, please Sign up first.