Ruby 关于 Ruby 内存使用的一些优化和探索
前段时间写了一个 benchmark 来测试下最近写的一个服务的 api,发现随着访问次数的增加,使用内存在慢慢上升,在上升到一定量之后,使用的内存基本稳定了下来。当然除了本身是一个图片上传的服务,需要消耗内存相比一般的 request 更多点之外,还是想弄明白下 ruby 内存是怎样一种回收和使用机制,为什么短时间内 Ruby 进程消耗的内存会增加如此之快,Ruby 内部的 Garbage Collect(简称 GC) 到底多久回收一次垃圾,到底怎么个回收流程,到底能把消耗的内存变小多少。于是便查阅了下 GC 相关的一些文档和内存跟踪的一些使用工具,实践并总结了下可以优化内存的一些方法,希望能对大家有所帮助。本文中使用的 Ruby 环境是 Ruby 2.1.4 + Rails 4.2.1, 后端 app server 使用的是 Unicorn, 运行在 2 台 AWS t2.large 上面,以及为了测试方便的本地 mac 机器(OS X 10.10.1)。由于本人经验和认知有限,若有失实之处,还望指正。也希望大家能畅所欲言,探讨并分享下自己的理解。
app server 方面着手
首先来看下测试开始前的状态 Unicorn 的内存使用状态,通过下面的命令查来看下占用内存最多的 15 个应用进程(在此隐去真实的服务器和项目相关信息,但测试数据均为实测数据)。你可以发现,这这里消耗内存最多的是我们的 Unicorn 应用进程,我在 Unicorn 配置文件里,每台机器配置了 10 个 worker_processes(为了让测试的效果更为拔群)。每个 Unicorn 进程大概占用了 2% 左右的内存,再加上 master 进程,总共占用了 21% 的内存总量。最初始的每个 Unicorn 所使用的内存量和你工程本身的大小有关系。在一个空的 Rails 工程中(本文使用 Rails 4.2.1 测试),占用了 70 多 m 左右的内存。
[user001@xxxx-web01 ~]$ ps -eo pmem,pcpu,vsize,pid,cmd | sort -k 1 -nr | head -15
 2.0  0.0 545968 25897 unicorn_rails master -c /home/app/image_test/production/current/config/unicorn.rb -E production -D
 1.9  0.0 545968 26124 unicorn_rails worker[9] -c /home/app/image_test/production/current/config/unicorn.rb -E production -D
 1.9  0.0 545968 26119 unicorn_rails worker[8] -c /home/app/image_test/production/current/config/unicorn.rb -E production -D
 1.9  0.0 545968 26116 unicorn_rails worker[7] -c /home/app/image_test/production/current/config/unicorn.rb -E production -D
 1.9  0.0 545968 26111 unicorn_rails worker[6] -c /home/app/image_test/production/current/config/unicorn.rb -E production -D
 1.9  0.0 545968 26104 unicorn_rails worker[5] -c /home/app/image_test/production/current/config/unicorn.rb -E production -D
 1.9  0.0 545968 26100 unicorn_rails worker[4] -c /home/app/image_test/production/current/config/unicorn.rb -E production -D
 1.9  0.0 545968 26098 unicorn_rails worker[3] -c /home/app/image_test/production/current/config/unicorn.rb -E production -D
 1.9  0.0 545968 26092 unicorn_rails worker[2] -c /home/app/image_test/production/current/config/unicorn.rb -E production -D
 1.9  0.0 545968 26090 unicorn_rails worker[1] -c /home/app/image_test/production/current/config/unicorn.rb -E production -D
 1.9  0.0 545968 26088 unicorn_rails worker[0] -c /home/app/image_test/production/current/config/unicorn.rb -E production -D
 0.6  0.0 1243972 2447 /opt/ds_agent/ds_agent -w /var/opt/ds_agent
 0.1  0.0 155540 17719 /usr/bin/perl -wT /usr/sbin/munin-node
 0.0  0.0 243976  2427 /sbin/rsyslogd -i /var/run/syslogd.pid -c 5
下面我们来运行下 benchmark,benchmark 采用了多线程的方式来访问我的 api 服务,在近三分钟的时间内,总共上传了 1500 张图片并做了相关的人脸识别处理,再来看下我们的内存占用前 15 位的内存使用状况。我们能够发现,Unicorn 进程的内存除了 master 进程之外,各个 workers 都和以前相比有了较大的增加。从最低的 1.9% 增加到了 3.6% 左右。
[user001@ipsa-web01 ~]$ ps -eo pmem,pcpu,vsize,pid,cmd | sort -k 1 -nr | head -15
 3.6  0.0 675644 26119 unicorn_rails worker[8] -c /home/app/image_test/production/current/config/unicorn.rb -E production -D
 3.6  0.0 671416 26090 unicorn_rails worker[1] -c /home/app/image_test/production/current/config/unicorn.rb -E production -D
 3.6  0.0 669144 26098 unicorn_rails worker[3] -c /home/app/image_test/production/current/config/unicorn.rb -E production -D
 3.5  0.0 668872 26092 unicorn_rails worker[2] -c /home/app/image_test/production/current/config/unicorn.rb -E production -D
 3.5  0.0 667220 26100 unicorn_rails worker[4] -c /home/app/image_test/production/current/config/unicorn.rb -E production -D
 3.5  0.0 663384 26116 unicorn_rails worker[7] -c /home/app/image_test/production/current/config/unicorn.rb -E production -D
 3.4  0.0 661892 26088 unicorn_rails worker[0] -c /home/app/image_test/production/current/config/unicorn.rb -E production -D
 3.3  0.0 650784 26111 unicorn_rails worker[6] -c /home/app/image_test/production/current/config/unicorn.rb -E production -D
 3.3  0.0 645692 26124 unicorn_rails worker[9] -c /home/app/image_test/production/current/config/unicorn.rb -E production -D
 3.2  0.0 647860 26104 unicorn_rails worker[5] -c /home/app/image_test/production/current/config/unicorn.rb -E production -D
 2.0  0.0 545968 25897 unicorn_rails master -c /home/app/image_test/production/current/config/unicorn.rb -E production -D
 0.6  0.0 1243972 2447 /opt/ds_agent/ds_agent -w /var/opt/ds_agent
 0.1  0.0 155540 17719 /usr/bin/perl -wT /usr/sbin/munin-node
 0.0  0.0 243976  2427 /sbin/rsyslogd -i /var/run/syslogd.pid -c 5
在此基础上我再一次上传了 1500 张图片,下面是跑完之后各个进程的内存使用情况。我们发现这次各个 Unicorn worker 使用内存只是略有增加,但已经远小于上一次跑 benchmark 时的内存增幅了。
[user001@ipsa-web01 ~]$ ps -eo pmem,pcpu,vsize,pid,cmd | sort -k 1 -nr | head -15
 4.1  0.0 709428 26098 unicorn_rails worker[3] -c /home/app/image_test/production/current/config/unicorn.rb -E production -D
 3.8  0.0 689600 26116 unicorn_rails worker[7] -c /home/app/image_test/production/current/config/unicorn.rb -E production -D
 3.7  0.0 691624 26104 unicorn_rails worker[5] -c /home/app/image_test/production/current/config/unicorn.rb -E production -D
 3.6  0.0 676696 26088 unicorn_rails worker[0] -c /home/app/image_test/production/current/config/unicorn.rb -E production -D
 3.6  0.0 675644 26119 unicorn_rails worker[8] -c /home/app/image_test/production/current/config/unicorn.rb -E production -D
 3.6  0.0 671520 26100 unicorn_rails worker[4] -c /home/app/image_test/production/current/config/unicorn.rb -E production -D
 3.6  0.0 671416 26090 unicorn_rails worker[1] -c /home/app/image_test/production/current/config/unicorn.rb -E production -D
 3.6  0.0 669372 26124 unicorn_rails worker[9] -c /home/app/image_test/production/current/config/unicorn.rb -E production -D
 3.6  0.0 666984 26092 unicorn_rails worker[2] -c /home/app/image_test/production/current/config/unicorn.rb -E production -D
 3.2  0.0 651596 26111 unicorn_rails worker[6] -c /home/app/image_test/production/current/config/unicorn.rb -E production -D
 2.0  0.0 545968 25897 unicorn_rails master -c /home/app/image_test/production/current/config/unicorn.rb -E production -D
 0.6  0.0 1243972 2447 /opt/ds_agent/ds_agent -w /var/opt/ds_agent
 0.1  0.0 155540 17719 /usr/bin/perl -wT /usr/sbin/munin-node
 0.0  0.0 243976  2427 /sbin/rsyslogd -i /var/run/syslogd.pid -c 5
然而,可以发现的是内存占用最大的进程从已经从最初的 1.9% 到了 4.1%,如果继续这样下去的话,每个 Unicorn worker 使用的内存可能会越来越大(事实上也是如此,在此就不再把相关的运行结果列出来了)。这个时候,如果我们能够限制每个 Unicorn worker 的大小,总体来说就能控制了 Unicorn 所占用的总内存大小。这个时候,我们可以利用一个叫unicorn-woker-killer 的工具来达到这一目的。它可以设置你的 request 个数达到设定值的时候杀死 worker,也可以在你 worker 内存达到设定值的时候杀死这个 worker。它的优点在于在杀死 unicorn woker 的时候并不会影响到你的 request 请求。
这个 gem 的使用方法非常简单,首先你的 Gemfile 里面(最好放在group :production下面)设置如下:
group :production do
  gem 'unicorn-worker-killer’
end
然后在你 Rails 应用的 config.ru 文件中,require ::File.expand_path('../config/environment', __FILE__)之前,加入如下代码。
require 'unicorn/worker_killer'
use Unicorn::WorkerKiller::Oom, (260*(1024**2)), (290*(1024*2))
这里的 Unicorn::WorkerKiller::Oom指定的是内存,在这里设定 worker 使用内存达到 260M 和 290M 之间的值某个值时,就把这个 worker 杀死。注意这里某个值指的是 260M 到 290M 之间的一个随机值。(另:unicorn-worker-killer也可以通过设置 max 的 request 个数来杀死 worker,大家可以根据自己的需要设定,在这里就暂时不介绍)
设置好了之后,我们再来一发(上传 1500 张图片并处理),看看占用前 15 的进程有什么变化。(注意:由于设置好了需要重启 Unicorn,为了观察进程的变化,上面的设置我试验前就设置并部署好了)
[user001@xxxx-web01 ~]$ ps -eo pmem,pcpu,vsize,pid,cmd | sort -k 1 -nr | head -15
 4.1  0.0 709428 26098 unicorn_rails worker[3] -c /home/app/ipsa/production/current/config/unicorn.rb -E production -D
 3.9  0.0 693076 26092 unicorn_rails worker[2] -c /home/app/ipsa/production/current/config/unicorn.rb -E production -D
 3.8  0.0 699880 26124 unicorn_rails worker[9] -c /home/app/ipsa/production/current/config/unicorn.rb -E production -D
 3.8  0.0 691624 26104 unicorn_rails worker[5] -c /home/app/ipsa/production/current/config/unicorn.rb -E production -D
 3.8  0.0 689600 26116 unicorn_rails worker[7] -c /home/app/ipsa/production/current/config/unicorn.rb -E production -D
 3.6  0.0 676696 26088 unicorn_rails worker[0] -c /home/app/ipsa/production/current/config/unicorn.rb -E production -D
 3.6  0.0 675644 26119 unicorn_rails worker[8] -c /home/app/ipsa/production/current/config/unicorn.rb -E production -D
 3.6  0.0 671520 26100 unicorn_rails worker[4] -c /home/app/ipsa/production/current/config/unicorn.rb -E production -D
 3.1  0.0 634372 26111 unicorn_rails worker[6] -c /home/app/ipsa/production/current/config/unicorn.rb -E production -D
 2.9  1.2 619084 23679 unicorn_rails worker[1] -c /home/app/ipsa/production/current/config/unicorn.rb -E production -D
 2.0  0.0 545968 25897 unicorn_rails master -c /home/app/ipsa/production/current/config/unicorn.rb -E production -D
 0.6  0.0 1243972 2447 /opt/ds_agent/ds_agent -w /var/opt/ds_agent
 0.1  0.0 155540 17719 /usr/bin/perl -wT /usr/sbin/munin-node
 0.0  0.0 243976  2427 /sbin/rsyslogd -i /var/run/syslogd.pid -c 5
对比下上一次前 15 位的进程,我们发现一个变化,woker[1] 的 pid 发生了改变,并且由原来的内存使用 3.6% 变为 2.9%,这点说明,unicorn-woker-killer确实在限制各个 unicorn worker 大小的时候起到了作用,并在总使用内存的控制上起到了作用。当然,通过unicorn-worker-killer方式可以做到杀死 worker,也就可以通过 batch 的方式让他自动重启了,比如在 cron job 中根据时间来定期杀死 worker 进程,但这需要根据你的实际需要而定。
探讨完工具unicorn-worker-killer的使用,你可能也会发现,这 Unicorn worker 的数目也太多了。为了实验的效果更为拔群,我在每台机器上启动了 10 个 worker 来处理 request。但实际使用的时候,你到底要需要几个 Unicorn worker 是你的访问量和请求处理的复杂度来决定的。当然理想的情况下,我希望有大概 20%-30%(这个数据只是我自己的一个喜好,并不代表标准)左右的 worker 处于比较空闲的状态,以便高峰到来的时候能够进行处理。那么,我们将 Unicorn 的 worker_processes 设置为 6,再次运行下 benchmark,来看下 Unicorn 使用内存的情况。
[user001@ipsa-web01 ~]$ ps ax -eo pmem,pcpu,pid,cmd | sort -k 1 -nr | head -15
 4.0  0.0  3947 unicorn_rails worker[5] -c /home/app/ipsa/production/current/config/unicorn.rb -E production -D
 3.6  0.0  3932 unicorn_rails worker[1] -c /home/app/ipsa/production/current/config/unicorn.rb -E production -D
 3.5  0.0  3938 unicorn_rails worker[3] -c /home/app/ipsa/production/current/config/unicorn.rb -E production -D
 3.5  0.0  3936 unicorn_rails worker[2] -c /home/app/ipsa/production/current/config/unicorn.rb -E production -D
 3.5  0.0  3930 unicorn_rails worker[0] -c /home/app/ipsa/production/current/config/unicorn.rb -E production -D
 3.3  0.0  3941 unicorn_rails worker[4] -c /home/app/ipsa/production/current/config/unicorn.rb -E production -D
 2.0  0.0  3743 unicorn_rails master -c /home/app/ipsa/production/current/config/unicorn.rb -E production -D
 0.5  0.0  2130 /opt/ds_agent/ds_agent -w /var/opt/ds_agent
 0.1  0.0  2555 /usr/bin/perl -wT /usr/sbin/munin-node
 0.0  0.1  6824 nginx: worker process
 0.0  0.0 24457 [kworker/1:2]
 0.0  0.0 16735 [kworker/0:0]
 0.0  0.0 15440 [kworker/0:1H]
 0.0  0.0  7699 head -15
上面的结果可以看到,虽然单个的 Unicorn worker 占用内存没有多大变化,但整体的 Unicorn 进程个数从 10 到 6,使用的总内存已经减少不小了。在使用前后两次 benchmark 的时候,记录了下运行时间,10 个 worker 的时候比 6 个 worker 的时候快 10 几秒,而不是第一次整体运行时间的 2/5,这说明其实最开始 Unicorn worker 是过多的,远超出我们的实际需要。由此可见,在满足访问需求的合理的前提下,尽量减少 Unicorn worker 的个数,能较大程度的减少你内存的使用。
Ruby 的 GC 和 Rails 方面着手
通过上面 Unicorn 的方式来改变内存使用的大小,虽然达到了效果,但还是没明白内存使用量变化究竟是怎么一回事。Unicorn 的内存使用中,除了最开始访问的时候需要将相关的代码加载入内存,程序内构建的对象所占用的内存外(包括代码,中间变量及请求数据和返回数据),以及一部分 cache 之外及程序可能存在 memory leak 之外,是什么东西的增加,让一个 worker 从 100 多 m 变到最大 300m 左右?Ruby 的垃圾回收是怎么工作的,怎么去判断他在正常工作呢?好在 Ruby 给我们提供了一些比较直观的 module。它们就是GC 和ObjectSpace 。
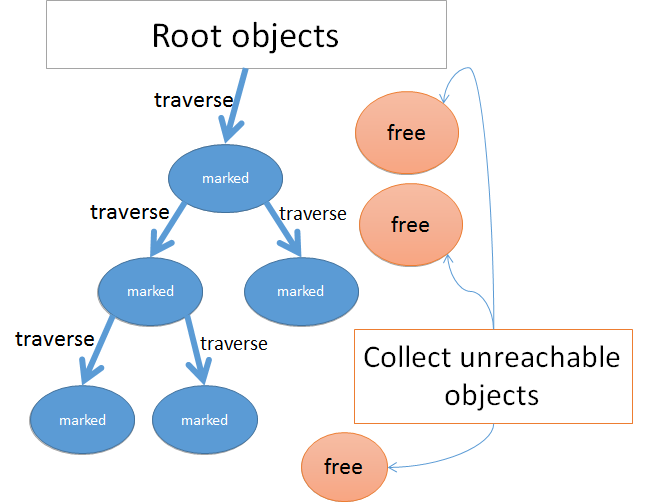
GC 提供了一些方法来了解 Ruby 的垃圾回收机制,ObjectSpace 则可以允许你查看现行状态下 living objects 的状态。在 Ruby 的 GC 中,采用了一种叫 mark and sweep 的机制来回收垃圾。比较简便的来说,GC 在回收垃圾的时候,它会从根对象开始遍历内存中的对象,如果能够 reach 那个对象,就 mark 下,最后再检查下所有的对象,看那些对象没有被 mark,就回收这些对象(即 sweep)。此处有一幅较为清楚的图来表现这一过程 (来源)
通过这一过程,能够大致的有个形象的认知,但是并不明了 Ruby 对象在内存中是怎样存在的。在 MRI 中,Ruby 有这样一种类似于 C 语言中结构体的结构,Ruby 中称其为 RValue 结构,对象被存放在这个结构体中。在结构体中,除了对象之外,还附有一个 flag,也就是我们前面所讲的在 mark-and-sweep 机制被 mark 时要使用的 flag。内存中,Ruby 将许多这样的 RValue 结构体组织在一种被称为 heap 的数组里面。在一个进程当中,有许多这样的 heap 数组存在。每个 RValue 结构体的大小是 40bytes,这也预示着这里不能存放较大的对象,故 Ruby 将一些较小的常用的 String, Array 或 Hash 等对象存放在此处。(详情可参考此文)
有了上面的一些基本的了解,我们就可以通过小小的实验来查看下 GC 的运行机制了。在 GC module 中,为我们提供了一个GC.stat方法来查看 GC 的状态。
下面在 irb 中来看看 GC 为我们提供了那些状态。
➜  ~  irb --simple-prompt
>> GC.stat
{
                            :count => 34,
                        :heap_used => 261,
                      :heap_length => 261,
                   :heap_increment => 0,
                   :heap_live_slot => 106167,
                   :heap_free_slot => 216,
                  :heap_final_slot => 0,
                  :heap_swept_slot => 12646,
            :heap_eden_page_length => 261,
            :heap_tomb_page_length => 0,
           :total_allocated_object => 891605,
               :total_freed_object => 785438,
                  :malloc_increase => 312768,
                     :malloc_limit => 16777216,
                   :minor_gc_count => 29,
                   :major_gc_count => 5,
          :remembered_shady_object => 784,
    :remembered_shady_object_limit => 850,
                       :old_object => 73265,
                 :old_object_limit => 82108,
               :oldmalloc_increase => 1036768,
                  :oldmalloc_limit => 16777216
}
GC.stat给我们返回了一个 Hash,其中 count 所指向的值是 GC 运行的次数,它是由 minor_gc_count + major_gc_count(29 + 5 = 34) 来组成的。其中 minor_gc_count 指的是 GC 进行的一次小型的回收,而 major_gc_count 则是 GC 进行的是一次 full 垃圾回收。之所以这样区分开来,是因为每次 minor 回收所需要使用的时间远小于 major 使用的时间。每次进行 GC 回收的时候,会消耗很大的资源和性能。根据情况进行 minor 回收能够较好的实现性能的提升。head_used 指代的是当前正在使用的 heap 的个数,而 heap_live_slot 指的是在 GC 运行以来,还存活的对象的个数。在此处,一个 heap 可以简单的理解为有很多个 slot 来组成,而 heap_free_slot 就是原来已经被分配的 slot,但是里面的对象已经被释放了,可以用来存放新的对象的 slot 的个数。
根据上面的一些概念,我们来做一个简单的实验。写一个简单的 script,来测试下 GC 运行的状态和内存使用的情况。script 如下:
 1 def report
 2   puts 'Memory ' + `ps ax -o pid,rss | grep -E "^[[:space:]]*#{$$}"`
 3         .strip.split.map(&:to_i)[1].to_s + 'KB'
 4 end
 5
 6 report
 7 puts GC.stat
 8
 9 long_str = "a" * 10_000_000
10 report
11 puts GC.stat
12
13 long_str = nil
14 ObjectSpace.garbage_collect
15 report
16 puts GC.stat
17
18 sleep 3
19 report
20 puts GC.stat
来看下运行的结果:
ruby -v memory_profiler.rb
ruby 2.1.4p265 (2014-10-27 revision 48166) [x86_64-linux]
Memory 7196KB
{:count=>5, :heap_used=>57, :heap_length=>81, :heap_increment=>24, :heap_live_slot=>22865, :heap_free_slot=>368, :heap_final_slot=>0, :heap_swept_slot=>3398, :heap_eden_page_length=>57, :heap_tomb_page_length=>0, :total_allocated_object=>41004, :total_freed_object=>18139, :malloc_increase=>519376, :malloc_limit=>16777216, :minor_gc_count=>3, :major_gc_count=>2, :remembered_shady_object=>151, :remembered_shady_object_limit=>300, :old_object=>5855, :old_object_limit=>11710, :oldmalloc_increase=>519824, :oldmalloc_limit=>16777216}
Memory 17036KB
{:count=>5, :heap_used=>58, :heap_length=>81, :heap_increment=>23, :heap_live_slot=>22938, :heap_free_slot=>703, :heap_final_slot=>0, :heap_swept_slot=>3398, :heap_eden_page_length=>58, :heap_tomb_page_length=>0, :total_allocated_object=>41077, :total_freed_object=>18139, :malloc_increase=>10533056, :malloc_limit=>16777216, :minor_gc_count=>3, :major_gc_count=>2, :remembered_shady_object=>151, :remembered_shady_object_limit=>300, :old_object=>5855, :old_object_limit=>11710, :oldmalloc_increase=>10533504, :oldmalloc_limit=>16777216}
Memory 7340KB
{:count=>6, :heap_used=>58, :heap_length=>81, :heap_increment=>23, :heap_live_slot=>7218, :heap_free_slot=>16423, :heap_final_slot=>0, :heap_swept_slot=>16446, :heap_eden_page_length=>58, :heap_tomb_page_length=>0, :total_allocated_object=>41146, :total_freed_object=>33928, :malloc_increase=>9448, :malloc_limit=>16777216, :minor_gc_count=>3, :major_gc_count=>3, :remembered_shady_object=>162, :remembered_shady_object_limit=>324, :old_object=>7008, :old_object_limit=>14016, :oldmalloc_increase=>9896, :oldmalloc_limit=>16777216}
Memory 7344KB
{:count=>6, :heap_used=>58, :heap_length=>81, :heap_increment=>23, :heap_live_slot=>7287, :heap_free_slot=>16354, :heap_final_slot=>0, :heap_swept_slot=>16446, :heap_eden_page_length=>58, :heap_tomb_page_length=>0, :total_allocated_object=>41215, :total_freed_object=>33928, :malloc_increase=>20568, :malloc_limit=>16777216, :minor_gc_count=>3, :major_gc_count=>3, :remembered_shady_object=>162, :remembered_shady_object_limit=>324, :old_object=>7008, :old_object_limit=>14016, :oldmalloc_increase=>21016, :oldmalloc_limit=>16777216}
我们可以看到,在创建 long_str 对象之前,进程的内存是 7196KB,在创建 long_str 之后,使用内存上升到 17036KB, 这个是可以理解的。再看我们在 script 的第 13,14 行将 long_str 置空,并通过 ObjectSpace 强行启动一次回收,使用内存是 7340KB, 使用的内存变小了,基本回到了对象创建前的大小。GC.stat中的 count 从 5 变成了 6,而且我们发现是 major_gc_count 从 2 变成了 3,也就是说启动的是一次 full 回收。并且,heap_live_slot 从 22938 变成了 7218,存活的对象的 slot 数目大幅减小,也就是说明很多对象已经被回收了。heap_free_slot 从原来的 703 变成了 16423,这个说明接下来如果进程还需要创建别的对象的话(需要的 slot 小于当前的 free_slot),可能就不需要操作系统分配新的内存而直接使用现在空闲的 free_slot 了。到底是不是上面的猜想呢,那我们再来实践下吧,将上面脚本的 18,19,20 行改成如下 ( 字符从 a 变成了 b):
18 long_str = “b" * 10_000_000
19 report
20 puts GC.stat
看下结果如何:
ruby -v memory_profiler.rb
ruby 2.1.4p265 (2014-10-27 revision 48166) [x86_64-linux]
Memory 7180KB
{:count=>5, :heap_used=>56, :heap_length=>81, :heap_increment=>25, :heap_live_slot=>22420, :heap_free_slot=>404, :heap_final_slot=>0, :heap_swept_slot=>3845, :heap_eden_page_length=>56, :heap_tomb_page_length=>0, :total_allocated_object=>41007, :total_freed_object=>18587, :malloc_increase=>518040, :malloc_limit=>16777216, :minor_gc_count=>3, :major_gc_count=>2, :remembered_shady_object=>151, :remembered_shady_object_limit=>300, :old_object=>5855, :old_object_limit=>11710, :oldmalloc_increase=>518488, :oldmalloc_limit=>16777216}
Memory 17028KB
{:count=>5, :heap_used=>57, :heap_length=>81, :heap_increment=>24, :heap_live_slot=>22493, :heap_free_slot=>739, :heap_final_slot=>0, :heap_swept_slot=>3845, :heap_eden_page_length=>57, :heap_tomb_page_length=>0, :total_allocated_object=>41080, :total_freed_object=>18587, :malloc_increase=>10531688, :malloc_limit=>16777216, :minor_gc_count=>3, :major_gc_count=>2, :remembered_shady_object=>151, :remembered_shady_object_limit=>300, :old_object=>5855, :old_object_limit=>11710, :oldmalloc_increase=>10532136, :oldmalloc_limit=>16777216}
Memory 7320KB
{:count=>6, :heap_used=>57, :heap_length=>81, :heap_increment=>24, :heap_live_slot=>7219, :heap_free_slot=>16013, :heap_final_slot=>0, :heap_swept_slot=>16036, :heap_eden_page_length=>57, :heap_tomb_page_length=>0, :total_allocated_object=>41149, :total_freed_object=>33930, :malloc_increase=>9432, :malloc_limit=>16777216, :minor_gc_count=>3, :major_gc_count=>3, :remembered_shady_object=>162, :remembered_shady_object_limit=>324, :old_object=>7009, :old_object_limit=>14018, :oldmalloc_increase=>9880, :oldmalloc_limit=>16777216}
Memory 17064KB
{:count=>6, :heap_used=>57, :heap_length=>81, :heap_increment=>24, :heap_live_slot=>7290, :heap_free_slot=>15942, :heap_final_slot=>0, :heap_swept_slot=>16036, :heap_eden_page_length=>57, :heap_tomb_page_length=>0, :total_allocated_object=>41220, :total_freed_object=>33930, :malloc_increase=>10020560, :malloc_limit=>16777216, :minor_gc_count=>3, :major_gc_count=>3, :remembered_shady_object=>162, :remembered_shady_object_limit=>324, :old_object=>7009, :old_object_limit=>14018, :oldmalloc_increase=>10021008, :oldmalloc_limit=>16777216}
可以发现使用的内存确实增加了,从 7320KB 变成了 17064KB,然而当前使用的 heap 个数(heap_used) 并没有变化,heap_live_slot 和 heap_free_slot 的变化也不大。Ruby 并没有将新的对象大量填充到 heap_free_slot,正因为先前所说的,heap 中的每个 RValue 结构体大小为 40bytes,并不能存放 long_str 那么大的字符串,当超出这个范围的时,Ruby 将其存放到了系统的 heap 去了,已经不由 RValue 结构来存储了。从上面的两次实验中也能看出,在每次启动 full 回收的时候,存储在系统 heap 中的大的对象被回收了,并且将这部分的内存归还给了操作系统。那么接下来就对比下,对于存放在 RValue 结构体中的变量,内存在垃圾回收后会不会将内存交还给系统呢?
将上面的最初始的代码做如下修改,将名称改为 long_array, 并赋予一个很长的字符串数组:
#long_str = "a" * 10_000_000
long_array = 10_000_000.times.map(&:to_s)
#long_str = nil
long_array = nil
看下改变之后的内存使用状态:
ruby -v memory_profiler.rb
ruby 2.1.4p265 (2014-10-27 revision 48166) [x86_64-linux]
Memory 7172KB
{:count=>5, :heap_used=>56, :heap_length=>81, :heap_increment=>25, :heap_live_slot=>22416, :heap_free_slot=>407, :heap_final_slot=>0, :heap_swept_slot=>3848, :heap_eden_page_length=>56, :heap_tomb_page_length=>0, :total_allocated_object=>41002, :total_freed_object=>18586, :malloc_increase=>517832, :malloc_limit=>16777216, :minor_gc_count=>3, :major_gc_count=>2, :remembered_shady_object=>151, :remembered_shady_object_limit=>300, :old_object=>5855, :old_object_limit=>11710, :oldmalloc_increase=>518280, :oldmalloc_limit=>16777216}
Memory 511440KB
{:count=>16, :heap_used=>24552, :heap_length=>28695, :heap_increment=>4143, :heap_live_slot=>10007226, :heap_free_slot=>341, :heap_final_slot=>0, :heap_swept_slot=>0, :heap_eden_page_length=>24552, :heap_tomb_page_length=>0, :total_allocated_object=>10041080, :total_freed_object=>33854, :malloc_increase=>29463768, :malloc_limit=>29936205, :minor_gc_count=>9, :major_gc_count=>7, :remembered_shady_object=>162, :remembered_shady_object_limit=>324, :old_object=>6497858, :old_object_limit=>7219894, :oldmalloc_increase=>49100440, :oldmalloc_limit=>20132659}
Memory 433404KB
{:count=>17, :heap_used=>19660, :heap_length=>28695, :heap_increment=>19603, :heap_live_slot=>7221, :heap_free_slot=>8006375, :heap_final_slot=>0, :heap_swept_slot=>8006398, :heap_eden_page_length=>57, :heap_tomb_page_length=>19603, :total_allocated_object=>10041149, :total_freed_object=>10033928, :malloc_increase=>9432, :malloc_limit=>29337480, :minor_gc_count=>9, :major_gc_count=>8, :remembered_shady_object=>162, :remembered_shady_object_limit=>324, :old_object=>7007, :old_object_limit=>14014, :oldmalloc_increase=>9880, :oldmalloc_limit=>19737900}
Memory 433408KB
{:count=>17, :heap_used=>19660, :heap_length=>28695, :heap_increment=>19603, :heap_live_slot=>7290, :heap_free_slot=>8006306, :heap_final_slot=>0, :heap_swept_slot=>8006398, :heap_eden_page_length=>57, :heap_tomb_page_length=>19603, :total_allocated_object=>10041218, :total_freed_object=>10033928, :malloc_increase=>20552, :malloc_limit=>29337480, :minor_gc_count=>9, :major_gc_count=>8, :remembered_shady_object=>162, :remembered_shady_object_limit=>324, :old_object=>7007, :old_object_limit=>14014, :oldmalloc_increase=>21000, :oldmalloc_limit=>19737900}
可以发现,分配大得数组之后使用内存飙升,从 7172KB 到 511440KB,GC 运行的次数也从 5 变成了 16,为系统分配了大量内存。在强行启动一次 full 回收之后,内存变为了 433404KB。和先前的例子对比下,发现内存在强行回收之后并没有回到之前的近似 7172KB 的内存大小,这是为什么呢?可以看到,long_array 是一个长度很大的数组,但是数组中的每个元素都很小,RValue 足够装下它。因此,虽然数组本身很大,但是这里的数组的元素还都是存在 RValue 结构中的,所以创建数组后 heap_used 的从 56 激增至 24552。但是在启动 full 回收后然而启动回收之后 heap_used 变成 19660,说明有一部分 heap 被回收了,仍然有很大一部分 heap 在使用。那又没有装对象呢?可以看到 heap_live_slot 由 10007226 个变成 7221,说明大部分对象都被释放掉了。很显然,Ruby 在释放对象这部分对象之后,并没有这部分对象占有的 heap 的内存全部交还给操作系统,即使你启动的是一次 full 的回收。这是 Ruby 的一种平衡,使得 Ruby 在下次分配对象的时候不需要时刻都向操作系统请求内存资源,而可以直接使用原来使用过的 free_slot。
由此可见,不管是在你的程序中哪里,应尽量去避免创建这种极大的对象。因为一般情况下,Ruby 为了性能考虑,并不会经常启动 full 回收,也就是说有一部分对象并不会做 sweep 处理,依然残留在内存中,这会导致你的内存逐渐变大。即使对象被回收之后,内存也不会立马变得很小。结合我们前面的 Unicorn 的实例,我在极短的时间内,做了 1500 次图片的上传及处理,内存也在短时间内飙升,并在一定时间内并没有减小太多,这个道理是一致的。Ruby 在短时间内大量对象被创建的时候,是会申请较多的内存来处理的。即使在 free 掉相关对象后不将这部分内存归还给操作系统,所以你看到的现象是我为什么请求都停下来了,内存怎么还不降下去呢。当内存上升到一定程度,Ruby 会使用先前的 free_slot 来存放新的对象,这也就是为什么访问上升到一定程度之后,继续请求,内存使用增加依然较小。
当然,除了上述情况之外,我们在写 Rails 和 Ruby 的时候还是要注意内存泄露的问题。在创建这些对象的时候,尽量不要把对象赋予给全局的变量或是类或 module 的属性,这会导致这些对象一直被 retained 而无法释放。此外,比较常用的跟 ActiveRecord 相关的操作,使用的好坏也对 Rails 内存有较大的影响。比如 model 的 all 和 find_each 方法的使用。在对数据库操作的时候,循环的使用是否合理等等,都对内存的使用会产生重大的影响。这里就不一一列举了。当然,应该还有许多我不知的相关方法来避免内存泄露和减少内存使用的问题,欢迎大家补充。
此外,由于 Ruby 的不同版本,采用的 GC 实现方式也不同,特别是早前的 1.8, 1.9, 升级到 2.0 之后的版本,性能会有较大的提升。特别是 web app, 最开始都使用的是同一份代码,由于 Ruby 版本 GC 的实现机制不同,导致 Copy On Write 机制被利用程度也不同。在此就不详细展开了。详细可以参考此文
总结下,以 Unicorn 服务器为例,可以通过减少 Unicorn 进程个数,杀死并重启新的 Unicorn Worker 来达到减少内存的使用。此外,通过对 Ruby 的 GC 机制的探讨,你可以尽量少创建大的对象及减少对全局变量的使用来控制内存。由于 Ruby 版本对于不同 GC 实现机制的不同,使得资源的使用效率上有着很大的差别,所以尽量把你的 Ruby 版本升级到 2.0 以上。
下面的参考文献对文中提到的有一些概念都有比较深入的探讨,建议有时间可以阅读下。另外,附几个查看内存相关的 gem
参考文献: http://patshaughnessy.net/2012/3/23/why-you-should-be-excited-about-garbage-collection-in-ruby-2-0 http://engineering.heroku.com/blogs/2015-02-04-incremental-gc/ http://samsaffron.com/archive/2013/11/22/demystifying-the-ruby-gc http://stackoverflow.com/questions/20385767/finding-the-cause-of-a-memory-leak-in-ruby
参考 gems: https://github.com/tmm1/rbtrace 这个可以在你测试时查看 GC 等运行的状态,GC 多久跑一次等都可以监测到 https://github.com/SamSaffron/memory_profiler 查看运行程序的内存状态 https://github.com/ko1/gc_tracer Ruby GC 作者写的,虽然没有试用过^_^