Introduction
Observation tools can help us understand and improve system performance. In this article, I will introduce how to observe Puma thread scheduling through eBPF.
The eBPF code used in this example can be found here: https://github.com/yfractal/sdb/blob/main/scripts/thread_schedule.py
How It Works
eBPF[1] allows us to probe kernel functions. We can use the command sudo bpftrace -l | grep -E "kprobe|kfunc" to find all available kernel functions.
Inspired by BCC offcputimfe.py, I use finish_task_switch as the instrumentation point. This function is called after the context switched to the new task(thread)[2], and we can get the previous task (thread) through the prev argument, and the current thread ID is the task that has been switched to. Its signature is:
static struct rq *finish_task_switch(struct task_struct *prev) __releases(rq->lock);
The program is straightforward: it records the start timestamp for the current thread. When the system suspends the thread, the thread occurs in the prev argument. At that point, we record the end timestamp and submit the event.
int oncpu(struct pt_regs *ctx, struct task_struct *prev) {
    u32 pid, tgid;
    u64 ts = bpf_ktime_get_ns();

    // current task
    u64 pid_tgid = bpf_get_current_pid_tgid();
    tgid = pid_tgid >> 32;
    pid = (__u32)pid_tgid;

    struct event_t event = {};
    event.pid = pid;
    event.tgid = tgid;
    bpf_get_current_comm(&event.name, sizeof(event.name));
    event.start_ts = ts;
    events_map.update(&tgid, &event);

    // previous task
    pid = prev->pid;
    tgid = prev->tgid;

    struct event_t *eventp = events_map.lookup(&tgid);
    if (eventp == 0) {
        bpf_trace_printk("prev is nil");
        return 0;
    }
    eventp->end_ts = ts;
    events.perf_submit(ctx, eventp, sizeof(*eventp));

    return 0;
}
The Results
Next, I created a simple HTTP server using Roda, and I used a Ruby script to send HTTP requests. After collecting the events, I converted it into the Perfetto trace format.
The result looks like this (the trace is available here):
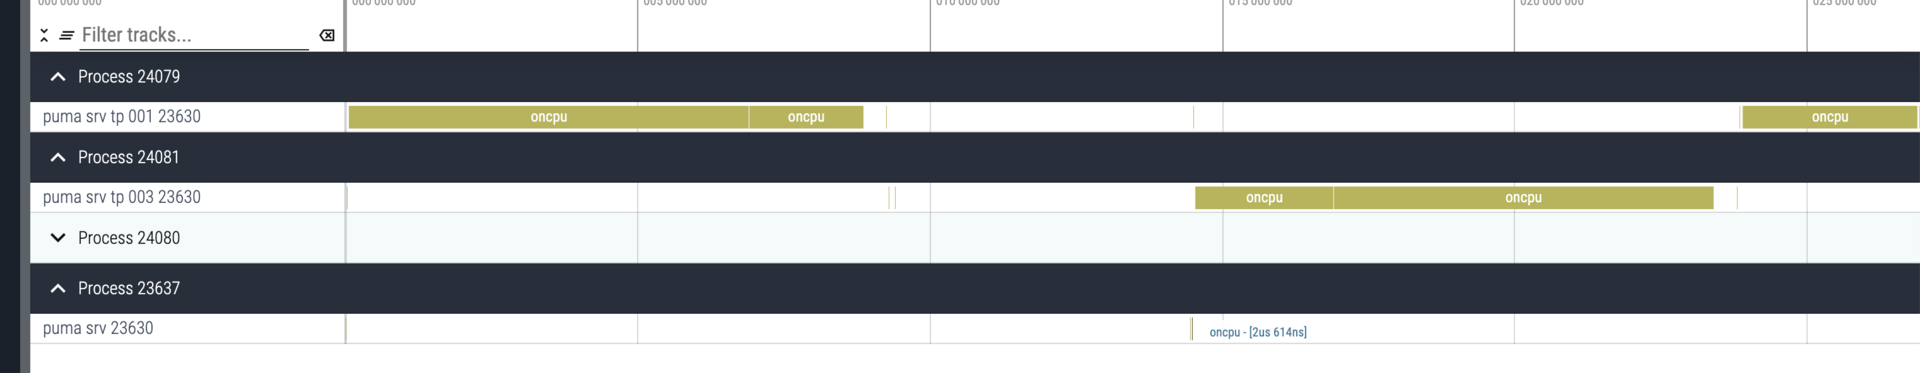
The puma srv 23630(the last thread in the image) is Puma’s server thread, which pulls ready I/O events through nio and distributes them to worker threads (the ThreadPool). So you can see that it is active for a very short period.
Others
One interesting finding is that when I use wrk for sending requests, I can barely see Puma’s server thread being active. This is because wrk enables keep-alive by default, and Puma reuses the previous connection, so the Puma server doesn’t need to wait for a new request.
Without eBPF, we only know the system schedules threads, but we don't know how frequently this happens or how long a thread runs. This visibility helps us understand the system better.
Next, I plan to link scheduling events with lock events to understand how the GVL and other locks affect a Ruby HTTP server.