Ruby Symbolizing Ruby ISeq Through eBPF
Introduction
A stack profiler scans the function stack, where we can find the function's address. To make this address meaningful, we need to retrieve the function name and other information—a process known as symbolization.
In this article, I will introduce how to symbolize Ruby instructions using eBPF and explain why I chose eBPF for this purpose. Its code is here https://github.com/yfractal/sdb/pull/7.
Background
We can think of the Ruby VM as a stack machine[1]. When it executes a function, it pushes the function address(ISeq) onto its stack, which is an array of rb_control_frame_struct. Simplified code is shown below:
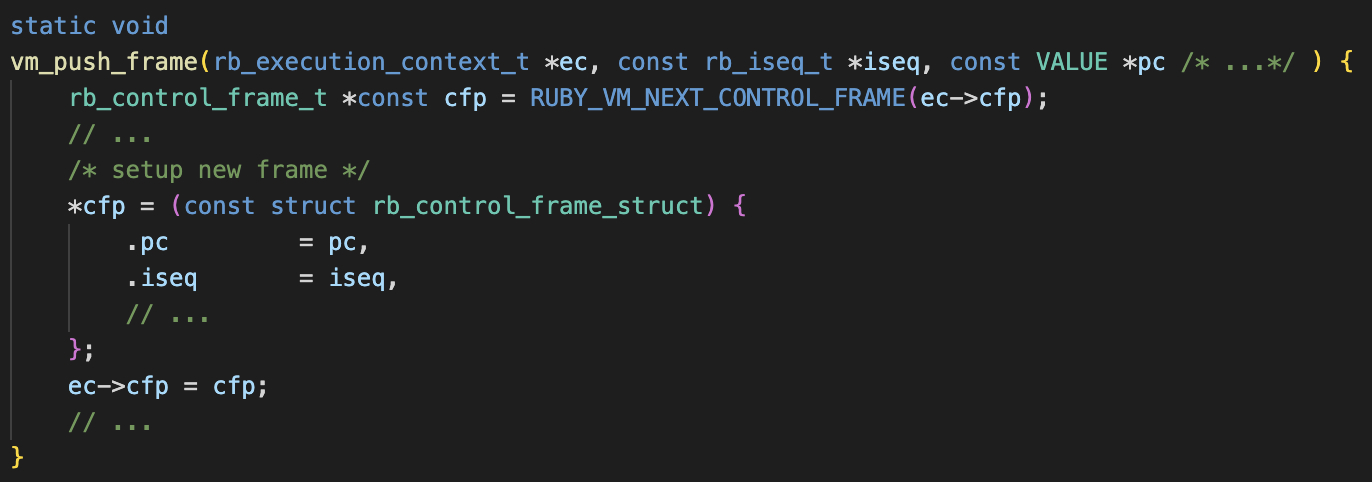
A stack profiler can scan the rb_control_frame_struct array and retrieve the functions that are currently executing.
Ruby natively supports this through rb_profile_frames, which fetches relevant information (iseq and line number). We can then retrieve additional details using functions like rb_profile_frame_method_name. Several tools make use of this approach, such as Shopify's stack_frames.
Why Another Stack Profiler?
Ruby already has several stack profiling tools, such as stackprof and Shopify's stack_frames. These tools use rb_profile_frames, which requires holding the Global VM Lock (GVL), blocking the execution of all other threads. Although Ruby has Reactor, it still blocks all threads within the Reactor, and the Reactor doesn’t seem to be widely adopted. Even without considering the GVL, these tools run in the application thread, adding additional delays to the application.
https://github.com/yfractal/sdb solves these issues by pulling stack frames without holding the GVL (see this code). As it doesn’t affect application threads, it can be used on the fly, even in production environments.
Troubles After Releasing the GVL
The Ruby GVL ensures VM data integrity, which includes the ISeq. When fetching an ISeq's fields, we need to get the GVL back. For performance reasons, we need to retrieve the ISeq’s information in batch. And in the puller thread, we couldn’t keep ISeq’s reference(we do not have GVL). And when we retrieve ISeq’s information, they could be freed by GC. Then it can cause segment fault.
We could mitigate this by waiting for Ruby VM to load all the code, checking the ISeq type, or catching segmentation faults.
That said, we can still improve the process. If asynchronous ISeq retrieval is error-prone, we can opt for synchronous retrieval. While Ruby doesn't load code all the time and the performance impact is minimal, I believe this is a reasonable trade-off.
SDB eBPF Symbolizer
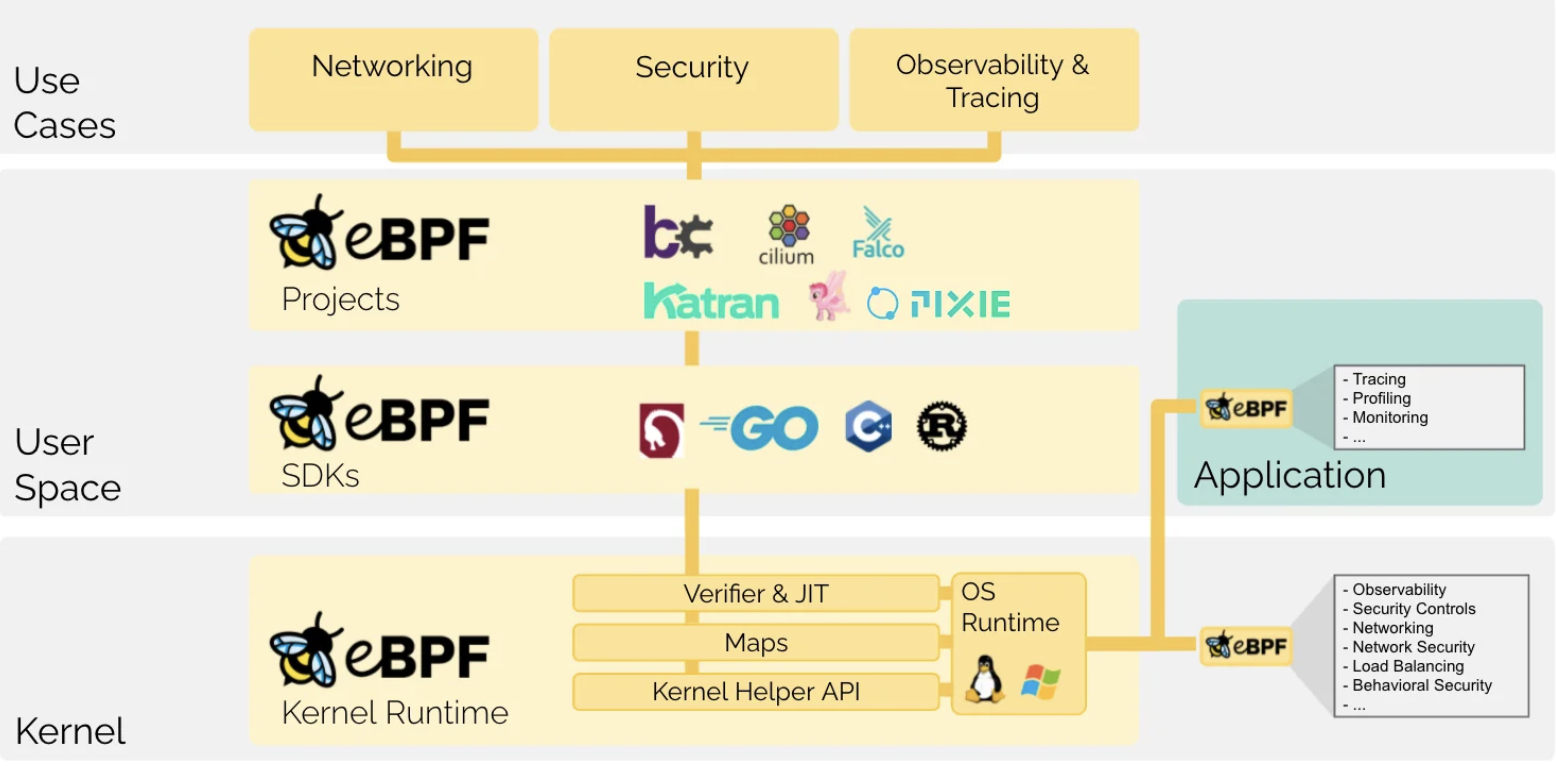
eBPF allows us to probe both kernel and user functions through kprobe and uprobe. It inserts a breakpoint instruction, and when this instruction is executed, it jumps to a predefined handler function[2][3].
We see, it executes code synchronously. So we can insert probes when the VM creates an ISeq and capture relevant information. Probing functions like rb_iseq_new_with_opt and rb_iseq_new_with_callback serve this purpose well.
Using bcc makes this relatively simple:
b = BPF(text=bpf_text)
binary_path = "/home/ec2-user/.rvm/rubies/ruby-3.1.5/lib/libruby.so.3.1"
b.attach_uprobe(name=binary_path, sym="rb_iseq_new_with_opt", fn_name="rb_iseq_new_with_opt_instrument")
b.attach_uretprobe(name=binary_path, sym="rb_iseq_new_with_opt", fn_name="rb_iseq_new_with_opt_return_instrument")
In rb_iseq_new_with_opt_instrument, we can get arguments by PT_REGS_PARMX. For example, in Ruby 3.1.5, the second argument of rb_iseq_new_with_opt is the function’s name, which we can obtain as follows:
struct RString *name;
bpf_probe_read(&name, sizeof(name), (void *)&PT_REGS_PARM2(ctx));
Since RString is not a C string, we need to convert it to a C string. However, because eBPF operates in a sandboxed environment and cannot call user-space functions, we need to implement the conversion ourselves.
Here is a simple implementation:
static inline int read_rstring(struct RString *str, char *buff) {
    u64 flags;
    char *ptr;
    unsigned long len;

    bpf_probe_read(&flags, sizeof(flags), &str->basic.flags);

    // Check if the string is embedded or heap-allocated
    if (flags & (1 << 13)) {
        bpf_probe_read(&len, sizeof(len), &str->as.heap.len);
        bpf_probe_read(&ptr, sizeof(ptr), &str->as.heap.ptr);

        if (ptr) {
            bpf_probe_read_str(buff, sizeof(buff), ptr);
        }

        return 1;
    } else {
        int len = get_embed_ary_len(str->as.embed.ary, MAX_STR_LENGTH);
        bpf_probe_read_str(buff, sizeof(buff), str->as.embed.ary);

        return 2;
    }
}
After obtaining the necessary information, we can submit it to the user program.
BPF_PERF_OUTPUT(events);

// rb_iseq_t *
// rb_iseq_new_with_opt(const rb_ast_body_t *ast, VALUE name, VALUE path, VALUE realpath,
//                      VALUE first_lineno, const rb_iseq_t *parent, int isolated_depth,
//                      enum iseq_type type, const rb_compile_option_t *option)
int rb_iseq_new_with_opt_instrument(struct pt_regs *ctx) {
    struct event_t event = {};

    struct RString *name;
    bpf_probe_read(&name, sizeof(name), (void *)&PT_REGS_PARM2(ctx));
    read_rstring(name, event.name);

    events.perf_submit(ctx, event, sizeof(*event));
    return 0;
}
Then, the data can be read in the user program as below:
def print_event(cpu, data, size):
    event = ctypes.cast(data, ctypes.POINTER(Event)).contents
    print(json.dumps(event.to_dict()))

b["events"].open_perf_buffer(print_event, 1024)

while True:
    try:
        b.perf_buffer_poll()
    except KeyboardInterrupt:
        exit()
The full code is here https://github.com/yfractal/sdb/pull/7.
Others
Probing ISeq creation alone is not enough. ISeq could be moved to other places during GC compacting. To detect this, we could probe gc_move and record the scan(source) and free(destination) address. As Ruby disables GC compaction by default, I leave it as a future work.
static VALUE gc_move(rb_objspace_t *objspace, VALUE scan, VALUE free, size_t slot_size);
Besides eBPF, binary instrumentation or ptrace could offer better alternatives, as they can access the application’s functions. However, since https://github.com/yfractal/sdb is still experimental, I chose eBPF for its simplicity.