新手问题 [已解决] 有人用过 chart.js 展示特大数字吗?能设置 scaleGridLine 吗?
问题
要用线图,用了 chart.js,需要背景格。 设置了
scaleGridLineColor: "#333",
scaleGridLineWidth: 1,
scaleLineColor: "#333",
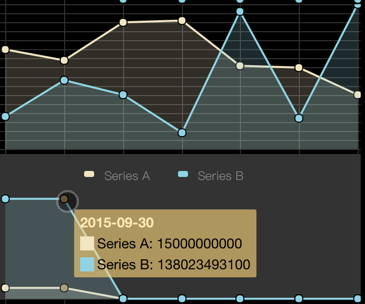
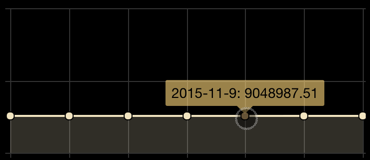
发现如果数字小,就能正常显示,如第二幅图。 但如果数字太大,比如我要显示的都是上百万的资产,就没法显示正常的 grid。我想是不是因为背景格太密集了,所以表现为一整片的颜色。 (还是排查好久,才得到这个 bug 的结论:原因是数字太大)
本来想试试那个:
// Boolean - If we want to override with a hard coded scale
 scaleOverride: true,
 // ** Required if scaleOverride is true **
 // Number - The number of steps in a hard coded scale
 scaleSteps: 10,
 // Number - The value jump in the hard coded scale
 scaleStepWidth: 1000,
 // Number - The scale starting value
 scaleStartValue: 0,
这能把 grid 横线控制在 10 根,但 data 的数量级其实是未知的,如果设定了跨度为 1000,那可能一些大的数值就出不来,线根本没有显示在图的范围内。 而且可能计算量太大了,这样设置常常死机。
那大家有看到可以设置这个 grid 的方案吗?
注:想 google 都不知道怎么描述,还是求助万能的 ruby-china 啦!急啊!
解决方案
参考帖子: How to display only integers in javascript chart.js how to change the Y-axis values from real numbers to integer in chartjs?
思路都是差不多的
var max= 100 //heighest value of your data
var step = 5;// According to your requirement
new Chart(ctx).Bar(plotData, {
    scaleOverride: true,
    scaleSteps: step,
    scaleStepWidth: Math.ceil(max / step),
    scaleStartValue: 0
});
 其实如果是单线,它是自动的,我感觉,为什么如果是双线,就变得这么复杂呢?
这是
其实如果是单线,它是自动的,我感觉,为什么如果是双线,就变得这么复杂呢?
这是