【编者按】原文作者 Emil Soman,Rubyist,除此之外竟然同时也是艺术家,吉他手,Garden City RubyConf 组织者。本文是 DIY Ruby CPU Profiling 的第一部分,由 OneAPM 工程师编译整理。 原文链接:http://crypt.codemancers.com/posts/2015-03-12-diy-ruby-cpu-profiling-part-ii/
 在 Codemancers,我们正在建设 Rbkit——一个针对 Ruby 语言的——拥有新炫酷功能的代码分析器。我目前正在实现一个嵌在 rbkit gem 里的 CPU 分析器,这将有助 rbkit UI 重建分析 Ruby 进程调用图,并在屏幕上得出有用的可视化展示。在这个过程中,我学到了许多新东西,很乐意在本系列的博客文章中与您分享。
我们打算一步一步从基础开始,专门为 Ruby 编写一个初级的 CPU 分析器!在完成时我们将学到:
- 什么是 CPU 分析
- 分析模式——工具和采样
- CPU Time 和 Wall Time ——它们分别是什么意思,如何测量?
- 写一个简单的 C 扩展并用于 Ruby 中
- Ruby Tracepoints——调用和返回
- C 语言中的信号处理
- 用一个信号暂停 Ruby 进程并用调用堆查看
- 用分析数据进行一些有用但笨拙的试验
Part I. 介绍 CPU 分析
通过对你的程序进行 CPU 分析,可以发现相较于 CPU 使用率,你的程序是多么宝贵。为了分析程序,你需要使用一个分析工具并按照下列步骤操作:
- 开始 CPU 剖析
- 执行你想要分析的代码
- 停止 CPU 剖析并得到剖析结果
- 分析结果
- 通过分析剖析结果,你会发现使整个程序缓慢的瓶颈。
分析模式
CPU 剖析可以分为以下两种方法:
1. 工具
在这种模式下,分析工具利用一些 hooks,由解释器提供或者插入程序中,来了解调用图并测量在调用图中每个方法的执行时间。举个例子,看一下下面这段 Ruby 代码:
def main
  3.times do
    find_many_square_roots
    find_many_squares
  end
end


def find_many_square_roots
  5000.times{|i| Math.sqrt(i)}
end

def find_many_squares
  5000.times{|i| i**2 }
end

main
我已经插入了一些内容,来帮助了解如果 Ruby 解释器给了我们方法的调用和返回的 hooks,它们如何执行:
def main
  # method call hook gets executed
  3.times do
    find_many_square_roots
    find_many_squares
  end
  # method end hook gets executed
end

def find_many_square_roots
  # method call hook gets executed
  5000.times{|i| Math.sqrt(i)}
  # method end hook gets executed
end

def find_many_squares
  # method call hook gets executed
  5000.times{|i| i**2 }
  # method end hook gets executed
end

main
现在,如果我们能够打印出当前时间和这些 hooks 内部当前方法的名称,会得到看起来像这种形式的输出结果:
sec:00 usec:201007  called      main
sec:00 usec:201108  called      find_many_square_roots
sec:00 usec:692123  returned    find_many_square_roots
sec:00 usec:692178  called      find_many_squares
sec:00 usec:846540  returned    find_many_squares
sec:00 usec:846594  called      find_many_square_roots
sec:01 usec:336166  returned    find_many_square_roots
sec:01 usec:336215  called      find_many_squares
sec:01 usec:484880  returned    find_many_squares
sec:01 usec:484945  called      find_many_square_roots
sec:01 usec:959254  returned    find_many_square_roots
sec:01 usec:959315  called      find_many_squares
sec:02 usec:106474  returned    find_many_squares
sec:02 usec:106526  returned    main
正如你所看到的,此输出可以告诉我们在每一种方法里面花了多长时间。同时也告诉我们,每一个方法调用的次数。这大概就解释了性能分析工具是如何工作的。
优点:
高精度 我们得到了方法调用数 易于实施
缺点:
每个被分析的方法执行 hooks 时的额外开销
2. 采样
在采样模式下,分析器每隔 x 时间单元打断一次程序,并查看调用堆并记录它的信息(被称为“样品”)。一旦该程序完成运行,分析器收集所有样品并找出每个方法出现在所有样品中的次数。 很难想象?让我们来看看同样的例子代码,看看如果我们使用采样分析器,输出结果会有怎样的不同。 采样分析器的输出结果如下:
Call stack at 0.5sec: main/find_many_square_roots
Call stack at 1.0sec: main/find_many_square_roots
Call stack at 1.5sec: main/find_many_square_roots
Call stack at 2.0sec: main/find_many_squares
在这个例子中,程序每 0.5 秒被中断一次并且调用堆栈被记录。因此,通过这个程序执行的过程我们得到了 4 个样品,find_many_square_roots 记录于 3 个样品中, find_many_squares 只存在于一个样品中。从本次采样中,我们得到 find_many_square_roots 占用了 75% CPU,与此同时 find_many_squares 只占用了 25% 的 CPU。这就大概解释了分析器是怎么样工作的。
优点:
- 与工具分析相比开销可忽略不计
- 很容易找到缓慢/长时间运行的方法
缺点:
- 不擅长测量短时间运行的方法
- 我们没有得到方法调用数
- 很难自己写出采样分析器
概括
我们只是调查了 CPU 分析的含义和两种常用的 CPU 分析方法。在第 2 部分,我们将探讨对描述 CPU 使用情况的 2 个单位进行测量—— CPU Time 和 Wall Time。我们也会亲手写一些代码来获取进行测量。感谢您的阅读!
========================================装 订 线 内 不 准 写 字=============================================
在第一部分中我们学习了 CPU 分析的含义和进行 CPU 分析的两种方法,在这一部分我们将研究 CPU time 和 Wall time,这些部分总被用来测量执行开销。我们也会写一些实现这些测量方法的代码作为建立 CPU 分析的第一步。
Part II. CPU time 和 Wall time
Wall time
Wall time 是在一个方法被调用和返回之间的真实时间。因此,如果你想要测量一个方法执行的「Wall clock time」,理论上可以用秒表来测量。只要在方法开始执行时打开秒表,在方法返回时按下停止。这个时间通常也被称为真实时间。
关于 Wall time 很重要的一点是,可以预见,每次试图测量同一段代码可能得到不同的结果。这是因为一系列后台进程会影响 Wall time. 当 CPU 同时运行多个进程的时候,操作系统给同时运行的进程排期并且试图为它们公平的分配 CPU 空间。这意味着 CPU 花费的总时间被分成多个片而我们的方法只占用其中的一些时间片。因此,当 Wall clock 开始计时,我们的进程可能会闲置并且为并行运行的其他进程让路。这意味着花费在其他进程的时间将增加我们的 Wall time!
CPU time
CPU time 是指 CPU 执行方法的时间。CPU time 的度量单位是用于执行方法的 CPU 时钟周期。如果我们了解 CPU 频率,它的单位是周期每秒,也可以称作赫兹,那么我们可以将其转换为时间。如果 CPU 执行某一方法花了 x 个时钟周期,这个 CPU 频率是 y 赫兹,那么 CPU 执行方法的时间为 x/y 秒。有时操作系统会为我们自动进行转换从而使我们免于进行这种计算。 CPU 时间不等同于 Wall time,其中的差别在于方法的指令类型。我们可以宽泛的将指令分为两种类型:CPU 密集型 和 I/O 密集型。在执行 I/O 指令时,CPU 空闲下来可以转去执行其他 CPU 密集型指令。因此,如果我们的方法在 I/O 指令上花费时间,CPU 可以不把时间投入在该方法上,而是去处理其他事情,直到 I/O 操作完成。这段时间内 Wall time 在计时而 CPU time 停止计时,落后于 Wall time.
我们来看看一个需要 5 分钟来执行的慢方法的情况。如果想知道这个方法花费了多长时间,你的 Wall clock 可以显示「执行该方法需要五分钟」,但 CPU 会显示「执行该方法中用时 3 分钟」。所以应该听从哪一个说法呢?究竟哪个时间能够更准确的测量执行方法的时间?
答案是:看情况。这取决于你希望测量的方法的类型。如果该方法的大部分时间用于 I/O 操作,或者该方法没有直接处理 CPU 密集型指令,由 CPU time 描述的时间开销将十分不准确。对于这些类型的方法,通过 Wall time 来测量时间更加合适。而对于其他情况,坚持通过 CPU time 来测量是很可靠的。
测量 CPU time 和 Wall time
鉴于想要写一个 CPU 分析器,我们需要一种测量 CPU time 和 Wall time 的方法。下面来看一看已经能够测量这两项的 Ruby 的 Benchmark module 中的代码。
def measure(label = "") # :yield:
  t0, r0 = Process.times, Process.clock_gettime(BENCHMARK_CLOCK)
  yield
  t1, r1 = Process.times, Process.clock_gettime(BENCHMARK_CLOCK)
  Benchmark::Tms.new(t1.utime  - t0.utime,
                     t1.stime  - t0.stime,
                     t1.cutime - t0.cutime,
                     t1.cstime - t0.cstime,
                     r1 - r0,
                     label)
end
由此可见,Ruby 通过两种进程类中的方法来测量时间:
- 通过
times测量 CPU time. - 通过
clock_gettime来测量真实时间,也就是 Wall time. 但是times方法返回的结果为 1 秒,这表示通过分析器用times只能测量仅需要几秒就能完成的 方法的 CPU time. 然而clock_gettime就有趣多了。
clock_gettime
Process::clock_gettime是早在 Ruby 2.1 版本就已经被添加的方法,它使用 POSIX clock_gettime()功能并回退到 OS 仿真来获得时间以防clock_gettime在 OS 中失效或无法实施。该功能接受clock_id及时间结果作为参数。有很多可以被选为这种计时器的clock_ids,但我们感兴趣的是:
-
CLOCK_MONOTONIC: 这个计时器测量逃走的 Wall clock time,因为过去的任意时间点不会被系统时钟的变化影响,最适合测量 Wall time. -
CLOCK_PROCESS_CUPTIME_ID: 这个计时器测量每一个进程的 CPU time,意即计算进程中所有线程的时间。我们可以用它来测量 CPU time. 让我们利用这个来写一些代码:
module DiyProf
  # These methods make use of `clock_gettime` method introduced in Ruby 2.1
  # to measure CPU time and Wall clock time.

  def self.cpu_time
    Process.clock_gettime(Process::CLOCK_PROCESS_CPUTIME_ID, :microsecond)
  end

  def self.wall_time
    Process.clock_gettime(Process::CLOCK_MONOTONIC, :microsecond)
  end
end
可以在 benchmark 代码中使用这些方法:
puts "****CPU Bound****"
c1, w1 = DiyProf::cpu_time, DiyProf::wall_time
10000.times do |i|
  Math.sqrt(i)
end
c2, w2 = DiyProf::cpu_time, DiyProf::wall_time
puts "CPU time\t=\t#{c2-c1}\nWall time\t=\t#{w2-w1}"

puts "\n****IO Bound****"
require 'tempfile'

c1, w1 = DiyProf::cpu_time, DiyProf::wall_time
1000.times do |i|
  Tempfile.create('file') do |f|
    f.puts(i)
  end
end
c2, w2 = DiyProf::cpu_time, DiyProf::wall_time
puts "CPU time\t=\t#{c2-c1}\nWall time\t=\t#{w2-w1}"
运行这些代码会得出类似以下的结果:
****CPU Bound****
CPU time    =   5038
Wall time   =   5142

****IO Bound****
CPU time    =   337898
Wall time   =   475864
这些清楚地展现了单个 CPU 内核的情况,在仅运行 CPU 密集型指令时 CPU time 和 Wall time 几乎相等,而运行 I/O 密集型指令时 CPU time 总是少于 Wall time.
概括
我们学习了 CPU time 和 Wall time 的含义与差异,以及什么时候用哪种。与此同时,写了一些 Ruby 代码来测量 CPU time 和 Wall time 来为我们做的 CPU 分析器测量时间。在第三部分我们将讨论 Ruby TracePoint API 并利用它做一个仪表分析器。
========================================装 订 线 内 不 准 写 字=============================================
在第一部分我们了解到仪表分析器如何工作,在第二部分我们学习到如何使用 CPU time 和 Wall time 测量执行时间。建议在继续学习之前先阅读一下那些内容。本章我们将应用学到的目前为止知识做一个很基础的仪表 CPU 分析器。
Part III. DIY 仪表 CPU 分析器
Ruby 的仪表盘
在第一部分,我们学到了仪表分析工具利用能够被分析工具安装或由语言自身提供的 hooks 来工作。幸运的是,Ruby 早就拥有这些 hooks 并且提供纤巧的TracePoint类来使用这些 hooks。
TracePoint API
执行代码时,Ruby VM 发送一系列事件到不同的节点。Ruby 允许利用TracePoint类进行事件回调。TracePoint的 API 文档列出了所有可以监听的事件,但我们只对下面两个感兴趣:
-
:call,当 Ruby 方法调用时被触发。 -
:return, 当 Ruby 方法返回时被触发。 我们可以通过TracePoint.new方法创造 tracepoint 对象并传递一个事件类型进行监听,同时传递部分在事件触发时执行的代码。下面是为:call和:return事件创造 tracepoint 的代码。
trace = TracePoint.new(:call, :return) do |trace|
  puts "Method: #{trace.method_id}, event: #{trace.event}"
end
被传到回调代码块的参数trace使你能够访问一系列 tracepoint 的属性,通过它们更加了解被触发的事件。举个例子,我们需要通过method_id属性得到 method name,通过event属性得到被触发的事件名。上文提到的回调代码块中将显示出方法名和被触发的事件类型,每一次都会伴随着 Ruby 方法的调用或返回。
建立 tracepoint 之后,需要将其变成可用状态:
trace.enable
一旦 tracepoint 变成可用状态,我们便可以创建方法对它进行调用,并且看我们出发的回调命令是否被执行。
def hello
end

hello

#=> Method: hello, event: call
#=> Method: hello, event: return
不错,我们的回调命令如预期的一样被执行了两次。
diy_prof gem
最后我们将结合之前学过的东西创造一个 RubyGem,并将这个 gem 命名为 diy_prof. 关于此 gem 的资源放在 github 上。 现在我们就用 bundler 来建造这个 gem:
bundle gem diy_prof
这就造出了我们将要做的项目的骨架。接着,我们将建立在 Part II 中介绍过的包含cpu_time和wall_time方法的 TimeHelpers模块:
# lib/diy_prof/time_helpers.rb

module DiyProf::TimeHelpers
  # These methods make use of `clock_gettime` method introduced in Ruby 2.1
  # to measure CPU time and Wall clock time.

  def cpu_time
    Process.clock_gettime(Process::CLOCK_PROCESS_CPUTIME_ID, :microsecond)
  end

  def wall_time
    Process.clock_gettime(Process::CLOCK_MONOTONIC, :microsecond)
  end
end
我们还需要请求 gem 主文件中的这个文件lib/diy_prof.rb:
# lib/diy_prof.rb

require 'diy_prof/version'
require 'diy_prof/time_helpers'
# Rest of the original file ..
下一步,当一个:call或return事件发生时,我们将通过 gem 里的 TracePoint API 来显示时间。
module DiyProf
  class Tracer
    include TimeHelpers

    def initialize(clock_type: :cpu)
      @tracepoint = TracePoint.new(:call, :return) do |trace|
        time = clock_type == :wall ? wall_time : cpu_time
        printf("%-20s:%-20s%-20s\n", time, trace.event, trace.method_id)
      end
    end
    def enable
      @tracepoint.enable
    end

    def disable
      @tracepoint.disable
    end
  end
end
同时,我们需要再一次调用这个 gem 主文件中的文件:
# lib/diy_prof.rb

require 'diy_prof/version'
require 'diy_prof/time_helpers'
require 'diy_prof/tracer'
# Rest of the original file ..
现在,让我们来写一个例子脚本来测试至今为止创造了什么。我们将使用在 Part I 中见过的那个例子:
# examples/demo.rb

$:<< File.join(File.dirname(__FILE__), "../lib")
require 'diy_prof'

### Begin sample program ###
def main
  3.times do
    find_many_square_roots
    find_many_squares
  end
end

def find_many_square_roots
  5000.times{|i| Math.sqrt(i)}
end

def find_many_squares
  5000.times{|i| i**2 }
end
### End sample program ###

tracer = DiyProf::Tracer.new(clock_type: :cpu)
tracer.enable
main
tracer.disable
如果运行了以上 Ruby 程序,我们将得到下列结果:
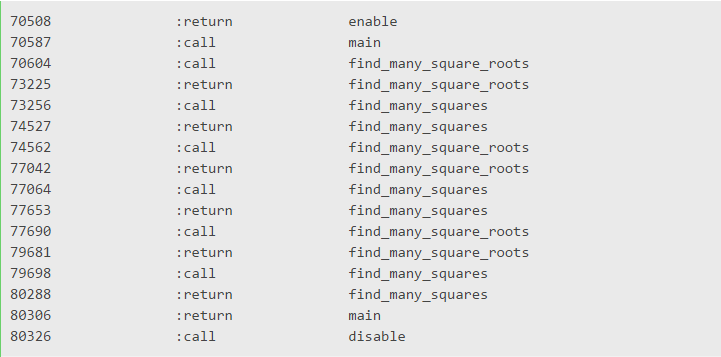 第一列显示的是被触发事件的 CPU time,第二列是被触发的事件名,第三列是被调用或返回的方法名。这个结果与在 Part I 中学习仪表分析器如何工作时看到的结果很相似。可以看到,我们能够轻松地通过这个结果重建调用,因为我们可以知道各个方法间的调用关系。写一个能解析这个结果并按执行时间有序显示方法列的脚本并不是很难。但这太无聊了,我们可以建造更有趣的东西。看着吧,下一部分将学习我们能够利用这些数据来做的其他事情。
概括
我们学习了 Ruby 的 TracePoint API 以及如何用它监听方法的调用和返回。同时我们整合写过的代码建立了一个能够显示 Ruby 程序的执行 trace 的 gem。在第四部分我们将学习如何有效利用 gem 收集到的数据并通过它们创造一些很酷的调用图。感谢阅读!如果你想要阅读 DIY CPU 分析系列的其他最新文章,请关注我们的 twitter @codemancershq.
========================================装 订 线 内 不 准 写 字=============================================
在第一部分我们了解了 CPU 分析器是如何工作的,在第二部分我们学习了如何通过 CPU time 和 Wall time 测量程序的执行时间,在第三部分我们学习了如何用 Ruby 的 TracePoint API 来跟踪 Ruby VM 中的方法调用和返回。我们还着手建立了自己的 DiyProf gem. 建议在继续之前先阅读这些。在这部分我们将利用通过 TracePoint API 收集到的数据创造一个简单的可视化调用图。
Part IV. 调用图
在第三部分,我们通过 Ruby 的 TracePoint API 来展示方法的调用和返回 trace. 如果可以解析这些 trace 并通过它们制作调用图,应该会更有用。调用图是用一种树形图来代表方法调用,进行基本的可视化。就像下图:
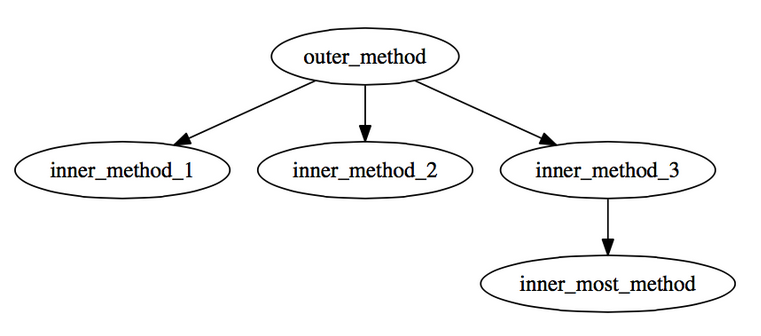 上图告诉我们
other_method从inner_method{1,2,3}中调用了三个方法,而inner_method_3调用了另一个名为inner_most_method的方法。
Graphviz 和 DOT 语言
Graphviz 是一种图形可视化工具,可以生成文本格式的图形说明,并生成 PDF 等多种格式的图表。为了用文本格式描述图形,Graphviz 使用一种名为 DOT 的语言,通过简单的声明描述节点和节点之间的关系。 在继续之前,先确保安装了 Graphviz 且 dot 命令在 $PATH 中可用。遵循安装步骤的官方文件即可。 举个例子,
digraph graph_name {
  a -> b -> c;
  b -> d;
}
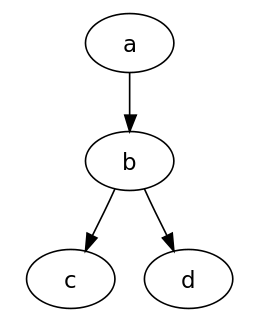
保存上述几条作为一个样本,dot 并运行下列命令。
dot -Tpdf sample.dot -o graph.pdf
上述命令将会生成一个直观的图,如下所示:
 还有另一种代表图的方法,通过分离节点和关系,如下:
digraph graph_name {
  <nodes>
  <connections>
}
因此下列 DOT 符号代表同样的图:
digraph graph_name {
  a;
  b;
  c;
  d;
  a -> b;
  b -> c;
  b -> d;
}
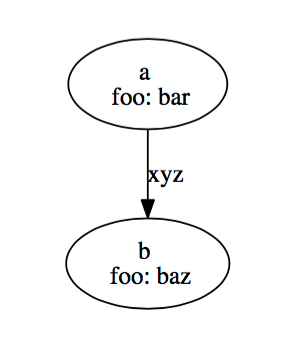
还可以为节点和关系添加附加标签。
digraph graph_name {
  a [label="a \n foo: bar"];
  b [label="b \n foo: baz"]
  a -> b [label="xyz"];
}
上述 DOT 代码代表下图:
Graphviz 调用图
我们想要为我们的 DiyProf gem 创造一个报告类,通过它来持续收集所有方法调用并创造一个 DOT 文件来代表调用图。
我们将在进入 DotReporter 类下面添加一个 record方法,DotReporter 类能够在调用发生时推送方法信息进堆,在方法返回时从堆中抛出方法信息。当方法信息被从堆中抛出,它在堆中花费的时间则被记录,并且向调用树添加方法调用信息。看下列代码:
module DiyProf
  # Struct that will hold a method name and a timestamp
  CallInfo = Struct.new(:name, :time)

  class DotReporter
    def initialize
      # A stack for pushing/popping methods when methods get called/returned
      @call_stack = []
      # Nodes for all methods
      @methods = {}
      # Connections between the nodes
      @calls = {}
    end

    def record(event, method_name, time)
      case event
      when :call
        @call_stack << CallInfo.new(method_name, time)
      when :return
        # Return cannot be the first event in the call stack
        return if @call_stack.empty?

        method = @call_stack.pop
        # Set execution time of method in call info
        method.time = time - method.time
        add_method_to_call_tree(method)
      end
    end
  end
end
add_method_to_call_tree 为被添加的方法增加节点和关系。下面是实现这一功能的代码:
# Struct that holds the time spent in a method
# and the total number of times a method was called
MethodInfo = Struct.new(:count, :total_time, :self_time)

def add_method_to_call_tree(method)
  # Add method as a node to the call graph
  @methods[method.name] ||= MethodInfo.new(0, 0, 0)
  # Update total time(spent inside the method and methods called inside this method)
  @methods[method.name].total_time += method.time
  # Update self time(spent inside the method and not methods called inside this method)
  # This will be subtracted when children are added to the graph
  @methods[method.name].self_time += method.time
  # Update total no of times the method was called
  @methods[method.name].count += 1

  # If the method has a parent in the call stack
  # Add a connection from the parent node to this method
  if parent = @call_stack.last
    @calls[parent.name] ||= {}
    @calls[parent.name][method.name] ||= 0
    @calls[parent.name][method.name] += 1

    # Take away self time of parent
    @methods[parent.name] ||= MethodInfo.new(0, 0, 0)
    @methods[parent.name].self_time -= method.time
  end
end
现在我们在@methods和@calls中都有节点和关系了,可以但不是必须要生成一个如下的文件:
digraph G {
  <graph_nodes>
  <graph_links>
}
下面是将在@methods和@calls中出现的代码,准备如下的 DOT 文件:
def dot_notation
  dot = %Q(
    digraph G {
      #{graph_nodes}
      #{graph_links}
    }
  )
end

def graph_nodes
  nodes = ""
  @methods.each do |name, method_info|
    nodes << "#{name} [label=\"#{name}\\ncalls: #{method_info.count}\\ntotal time: #{method_info.total_time}\\nself time: #{method_info.self_time}\"];\n"
  end
  nodes
end

def graph_links
  links = ""
  @calls.each do |parent, children|
    children.each do |child, count|
      links << "#{parent} -> #{child} [label=\" #{count}\"];\n"
    end
  end
  links
end
在 github repo 上检查lib/diy_prof/dot_reporter.rb文件,看看它们是怎样彼此配合的。我们同时还需要利用规定的报告类在第三部分写过的 Tracer 类中做一些改变:
module DiyProf
  class Tracer
    # We'll need to initialize the Tracer with DotReporter.new
    def initialize(reporter)
      @reporter = reporter
      @tracepoints = [:call, :return].collect do |event|
        TracePoint.new(event) do |trace|
          # Use the reporter instead of just printing the traces
          reporter.record(event, trace.method_id, cpu_time)
        end
      end
    end

    ...

    # New method added to collect the report after profiling
    def result
      @reporter.result
    end
  end
end
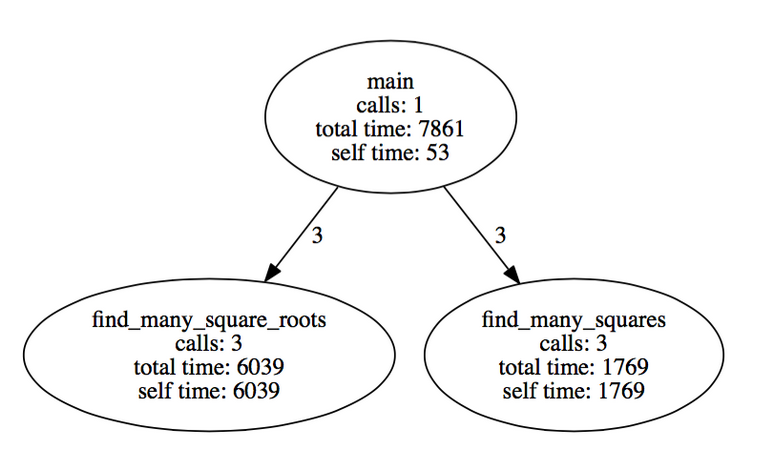
现在我们的 tracer 能够生成 DOT 格式的报告了,我们将它用在先前部分中写过的样本程序上:
def main
  3.times do
    find_many_square_roots
    find_many_squares
  end
end

def find_many_square_roots
  5000.times{|i| Math.sqrt(i)}
end

def find_many_squares
  5000.times{|i| i**2 }
end

DiyProf.start_profiling
main
result = DiyProf.stop_profiling

require 'tempfile'
f = Tempfile.open('dot')
f.write result
f.close
system("dot -Tpdf #{f.path} -o call_graph.pdf")
我们将得到一个如下所示的调用图:
 恭喜你已经进行到这一步,检查拥有完整代码的 github repo.
额外令人开心的事!
如果能基于本身或方法总时间区分节点大小岂不是很酷?DOT 语法允许节点和 edges 拥有一系列属性。就像我们可以用size和fontsize属性来区分节点和节点内的内容。我将把如何用过这些来使最重要的方法在调用图中着重显示,这个问题将留给你们。
概括
我们学习了关于 Graphviz 和 DOT 语言及如何它们创造基于 Ruby TracePoint API 收集到的数据的调用图表。在第五部分,我们将着手建立一个简单的 RUby 分析器,尤其会学到一些基本的 C 里的信号中断和处理。感谢阅读,如果想要获取关于 DIY CPU 分析系列的最新博客内容,请关注我们的推特 @codemancershq.
OneAPM for Ruby 能够深入到所有 Ruby 应用内部完成应用性能管理和监控,包括代码级别性能问题的可见性、性能瓶颈的快速识别与追溯、真实用户体验监控、服务器监控和端到端的应用性能管理。想阅读更多技术文章,请访问 OneAPM 官方博客。