Rails Newrelic 监测数据的解释

loveltyoic · 2014年11月25日 · 最后由 loveltyoic 回复于 2014年11月25日 · 2737 次阅读

Rails+Grape 提供 API,用 newrelic 监控。 下面这个 API 的响应达到了 1200ms 
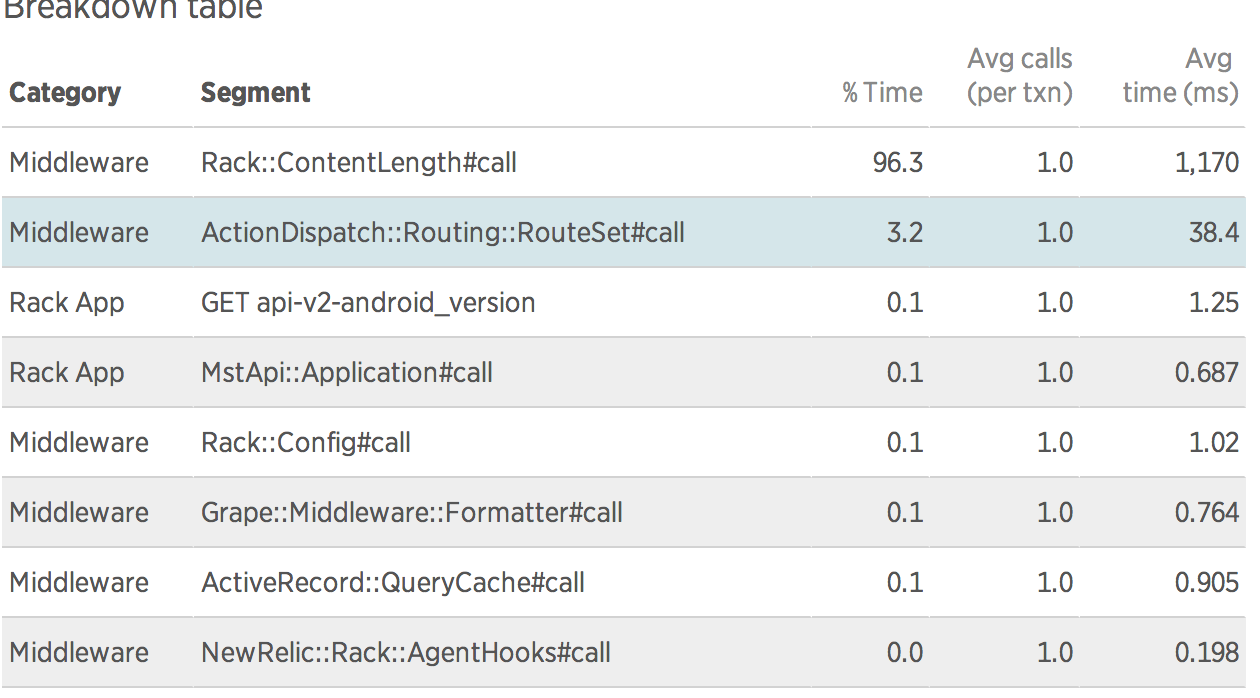
从图中看Rack::ContentLength#call极其耗时, 但是这个 API 只是返回下面的数据 { "status": "ok", "version": { "version_code": "1", "version_name": "1", "download": "http://mobile.mst365.cn/app", "desc": "1" } }

非常困惑为什么?有人遇到过这种情况并了解原因吗?

对Grape不了解呢,是不是将这个api里面执行ruby代码的时间都算到了Rack::ContentLength#call里面?

#2 楼 @quakewang 首先感谢回复! 这个 API 的代码只是请求另一个 API 并直接返回结果,而且我将结果缓存在 redis 了。 从图中看并没有发起外部请求,那么应该是直接读缓存数据并返回的。 redis 读不会要这么久吧,是否跟服务器性能有关呢?

newrelic 计算 external service 调用是通过检测 Net::Http 的代码调用,如果你调用另外一个 api,不是通过 net http(比如说是 socket),是不会统计在 external 里面的。

你可以在本地环境模拟,或者加一下日志,看代码执行到底耗费在哪里。

嗯,需要研究一下日志。 另外我也用 ab 测试了一下:

Concurrency Level:      20
Time taken for tests:   11.950 seconds
Complete requests:      1000
Failed requests:        0
Write errors:           0
Total transferred:      443000 bytes
HTML transferred:       117000 bytes
Requests per second:    83.68 [#/sec] (mean)
Time per request:       239.000 [ms] (mean)
Time per request:       11.950 [ms] (mean, across all concurrent requests)
Transfer rate:          36.20 [Kbytes/sec] received

Connection Times (ms)
              min  mean[+/-sd] median   max
Connect:       10  159 657.5     21    7782
Processing:    14   47  40.7     37     840
Waiting:       14   47  40.7     37     839
Total:         27  206 663.0     62    7979

平均 239ms, 为什么会差距这么大呢?

瞎猜没有用,安装这个就能看出 redis read/set占多少时间了:https://github.com/evanphx/newrelic-redis

7 楼 已删除
需要 登录 后方可回复, 如果你还没有账号请 注册新账号