JavaScript highcharts 传值
今天自学 highcharts,数据返回前台,我按 demo 上的格式给拼成 [["男",7],["女",5]] 的格式,传过去,不显示饼图,谁能帮我看看是哪里出问题了,多谢
<script type="text/javascript">
$(function () {
var rand = Math.random();
$.ajax( {
url : "./pietest.do",
type : "post",
async : false,
data: "rand="+rand,
dataType: "json",
contentType : "application/x-www-form-urlencoded; charset=utf-8",
success : function(data, textStatus) {
//var piedata = eval(data);
var l = data.length;
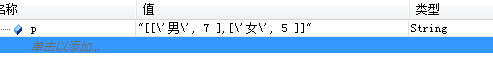
var p = "[";
debugger;
for(var i=0;i<l;i++){
if(i==(l-1)){
p+="['"+data[i].sex+"', "+data[i].mrs+" ]";
}else{
p+="['"+data[i].sex+"', "+data[i].mrs+" ],";
}
}
p+="]";
// p.prepend("[");
// p.append("]");
xspie(p);
},
error : function(XMLHttpRequest, textStatus, errorThrown) {
alert("服务器请求失败!");
}
});
});
function xspie(p){
$('#container').highcharts({
chart: {
plotBackgroundColor: null,
plotBorderWidth: 1,//null,
plotShadow: false
},
title: {
text: 'Browser market shares at a specific website , 2014'
},
tooltip: {
pointFormat: '{series.name}: <b>{point.percentage:.1f}%</b>'
},
plotOptions: {
pie: {
allowPointSelect: true,
cursor: 'pointer',
dataLabels: {
enabled: true,
format: '<b>{point.name}</b>: {point.percentage:.1f} %',
style: {
color: (Highcharts.theme && Highcharts.theme.contrastTextColor) || 'black'
}
}
}
},
series: [{
type: 'pie',
name: 'Browser share',
data: p
}]
});
}
</script>